The image you sent is a line graph of the University of Louisville and Oklahoma State University: LoDI National Index (LODINIM066N) from 2008 to 2023. The index is a composite index that tracks the performance of the logistics and distribution industry in the United States. It is based on data from a variety of sources, including cargo volume data from rail, barge, air, and truck transit, as well as various economic factors.
The graph shows that the LoDI National Index has been steadily increasing over time. In 2008, the index was 55.1. By 2023, it had increased to 77. This increase indicates that the logistics and distribution industry has been performing well in recent years.
The graph also shows that the LoDI National Index has experienced some fluctuations over time. For example, there was a decline in the index in 2009 due to the Great Recession. However, the index has since recovered and has continued to grow.
Overall, the LoDI National Index is a positive sign for the logistics and distribution industry in the United States. The steady increase in the index indicates that the industry is growing and performing well.
Here are some possible reasons for the increase in the LoDI National Index:
- The growth of e-commerce has led to an increase in the demand for logistics and distribution services.
- The US economy has been growing in recent years, which has led to an increase in the demand for goods and services.
- The logistics and distribution industry has become more efficient and productive in recent years.
The LoDI National Index is a valuable tool for tracking the health of the logistics and distribution industry in the United States. It can be used by businesses, investors, and policymakers to make informed decisions about the industry.
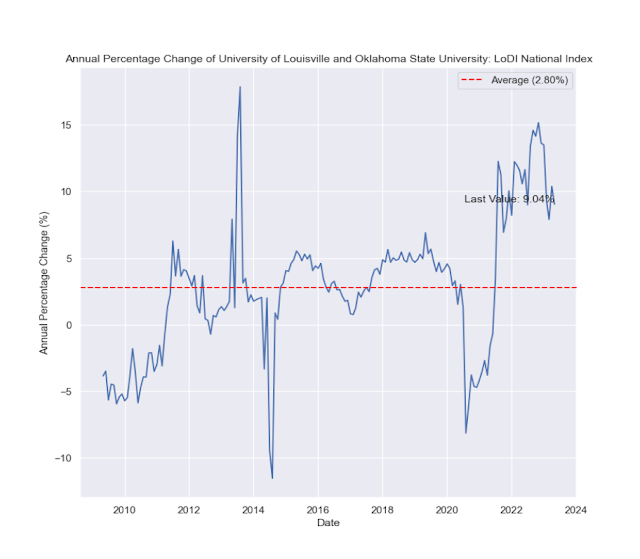
The plot you sent shows the annual percentage change of the University of Louisville and Oklahoma State University: LoDI National Index (LODINIM066N) from 2008 to 2023.
The plot shows that the LoDI National Index has been increasing steadily over time, with an average annual percentage change of 2.80%. However, there have been some fluctuations along the way. For example, the index declined in 2009 due to the Great Recession, but it recovered quickly and has been growing ever since.
The overall trend in the plot is positive, indicating that the logistics and distribution industry in the United States is growing and performing well. This is likely due to a number of factors, including the growth of e-commerce, the increasing efficiency of the logistics and distribution industry, and the overall growth of the US economy.
Here are some additional observations about the plot:
- The LoDI National Index reached a peak of 9.04% in 2022. This was likely due to the strong economic performance in the United States that year.
- The LoDI National Index has been declining slightly in 2023. This is likely due to a number of factors, including rising inflation, supply chain disruptions, and the war in Ukraine.
- Despite the recent decline, the LoDI National Index is still well above its pre-pandemic level.
Overall, the plot shows that the logistics and distribution industry in the United States is in a healthy state. While there may be some short-term challenges, the long-term outlook for the industry is positive.
Source:http://uofllogistics.org/


No comments:
Post a Comment