The image shows a heatmap of the percentage changes from the previous year for the Consumer Price Index for All Urban Consumers (CPI-U) in the United States, as of September 2023. The heatmap is color-coded, with darker colors representing higher rates of inflation and lighter colors representing lower rates of inflation.
The heatmap shows that the overall CPI-U increased by 3.69% from September 2022 to September 2023. However, there is a significant amount of variation in the inflation rates across different categories of goods and services.
The highest rates of inflation are seen in rent (7.41%), shelter (7.15%), and food away from home (5.96%). These categories are all essential expenses for most households, so the high inflation rates in these areas are likely to have a significant impact on people's budgets.
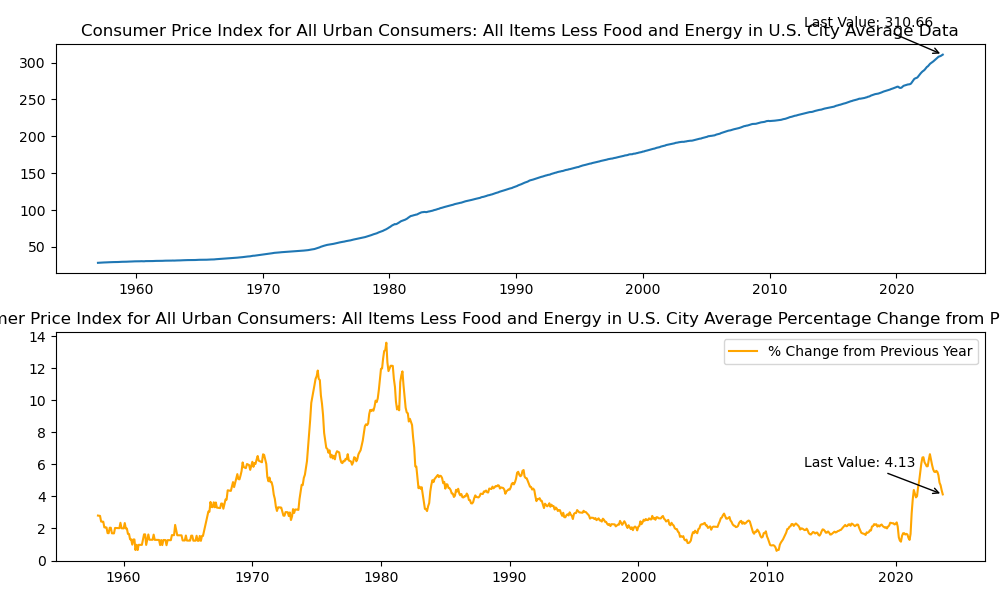
Other categories with relatively high rates of inflation include services less energy services (5.69%), all items less food and energy (4.13%), and food (3.69%).
The lowest rates of inflation are seen in used cars and trucks (-7.99%), medical care services (-2.64%), and medical care (-1.42%). It is important to note that the decline in the price of used cars and trucks is likely due to a number of temporary factors, such as a decrease in demand and an increase in supply.
Overall, the heatmap shows that inflation is a significant concern for many Americans. However, there are some signs that inflation may be moderating, as the overall CPI increase was slightly lower in September than in August.
.png)
The following plot shows the difference in percentage changes from the previous period for each variable in the Consumer Price Index for All Urban Consumers (CPI-U) in the United States, as of September 2023. The plot is a line chart, with each line representing a different category of goods and services.
The plot shows that the overall CPI-U increased by 0.40% from August 2023 to September 2023. However, there is a significant amount of variation in the percentage changes across different categories.
The largest percentage increases were seen in gasoline and propane (2.08%), food away from home (1.39%), and shelter (1.28%). The largest percentage decreases were seen in used cars and trucks (-2.53%), apparel (-0.76%), and energy (-0.48%).
The plot also shows that the percentage changes in some categories, such as food and beverages (0.23%) and medical care (0.21%), were relatively small.
Overall, the plot shows that inflation is continuing to rise in the United States, but at a slower pace than in recent months. It is important to note that the CPI-U is a measure of the average change over time in the prices paid by urban consumers for a basket of goods and services.
.png)
The two plots above show that inflation is a significant concern for many Americans, but there are some signs that it may be moderating.
The heatmap shows that the overall CPI-U increased by 3.69% from September 2022 to September 2023, but the line chart shows that the monthly increase was slightly lower in September 2023 (0.40%) than in August 2023 (0.60%).
The heatmap also shows that the highest rates of inflation are seen in essential expenses such as rent, shelter, and food away from home. This is likely to have a significant impact on people's budgets.
However, the line chart shows that the percentage changes in some categories, such as food and beverages and medical care, were relatively small in September 2023. This suggests that inflation may be starting to moderate in some areas.
Overall, the two plots provide a mixed picture of inflation in the United States. It is still too early to say whether inflation has peaked, but the signs are encouraging.


No comments:
Post a Comment