S&P/Case-Shiller Home Price Indices Percentage changes from Previous Year
The S&P/Case-Shiller Home Price Indices are a leading measure of U.S. residential real estate prices, tracking changes in the value of residential real estate nationally. The indices are published monthly and are based on repeat sales of single-family homes.
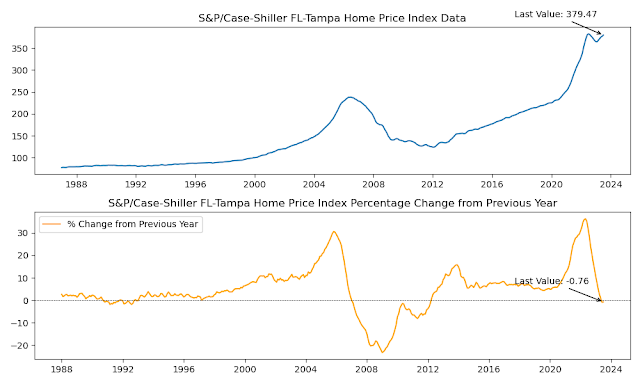
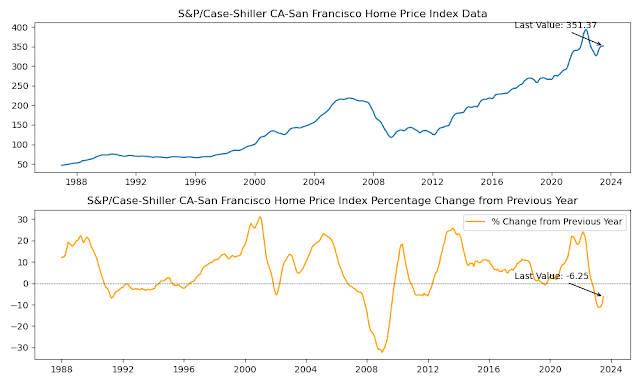
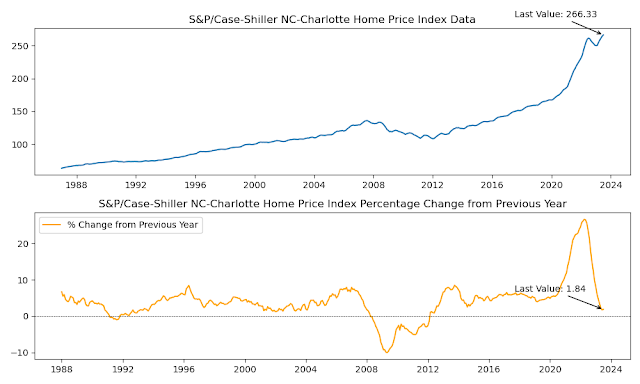
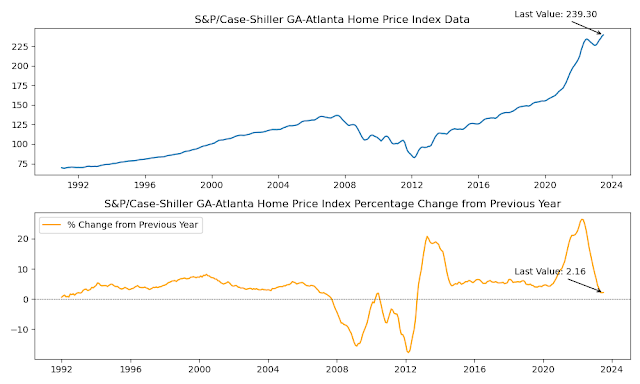
The following table shows the S&P/Case-Shiller Home Price Indices Percentages from Previous Year for selected cities and regions:
While the percentage changes from the previous year declined in some cities, the percentage changes from the previous month increased.
The following are some of the key trends to note:
- The Midwest is the region with the strongest home price growth, followed by the Northeast and the South.
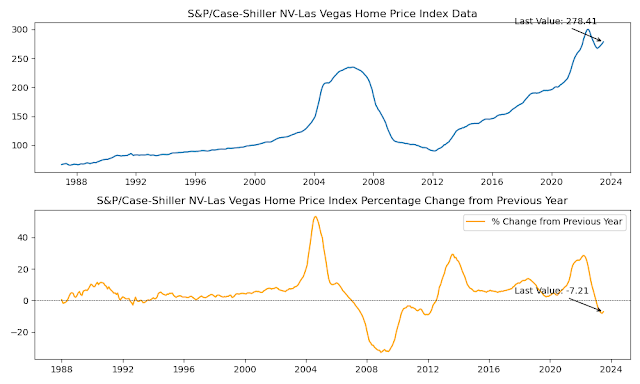
- The West is the region with the weakest home price growth, with some cities, such as San Francisco and Las Vegas, experiencing negative growth.
- The 10-City Composite and the 20-City Composite indices are both showing signs of moderation, suggesting that the national housing market is cooling.
Overall, the S&P/Case-Shiller Home Price Indices Percentages from Previous Year data suggests that the housing market is still relatively healthy, but it is starting to cool. This is likely due to a number of factors, including rising interest rates, inflation, and a shortage of homes for sale.









No comments:
Post a Comment