**Analyzing the Current State of Housing Vacancies and Home Ownership in the U.S.**
The housing market is a critical component of the U.S. economy, influencing various sectors from construction to finance. Recent data on housing vacancies and homeownership rates provide insights into the current state of the housing market and its potential implications for the economy. This article delves into the recent trends, their possible causes, and the potential implications for policymakers.
### **1. Key Trends in Housing Vacancies and Home Ownership**
- **Housing Vacancies:**
- **Overall:** The overall housing vacancy rate has seen an increase of 11.52% year-on-year and 12.44% month-on-month.
- **Rental:** The rental vacancy rate has risen by 3.13% from the previous year and 4.76% from the last month.
- **Homeowner:** Interestingly, the homeowner vacancy rate has decreased by 10.84% year-on-year but has surged by 14.29% in the past month.
- **Home Ownership:**
- The homeownership rate has dipped by 1.93% from the previous year. However, there's a silver lining as it has ticked up by 0.15% from the previous month.
### **2. Deciphering the Trends**
- **Overall Housing Vacancy:** Despite the yearly increase in the overall housing vacancy rate, there was a slight dip in the past month.
- **Rental Vacancy:** Both yearly and monthly figures indicate an upward trajectory in rental vacancies.
- **Homeowner Vacancy:** The past year saw a decline in homeowner vacancies, but the recent month witnessed an uptick.
- **Home Ownership Rate:** The homeownership rate has been on a decline year-on-year but showed a marginal increase in the past month.
### **3. Unraveling the Causes**
Several factors might be influencing these trends:
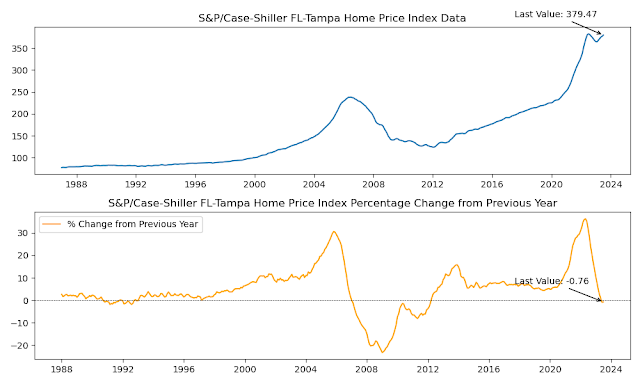
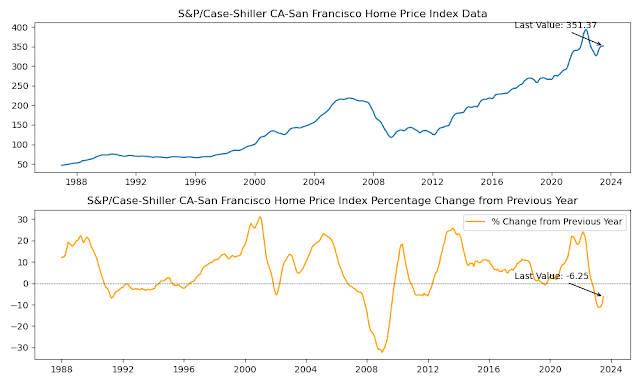
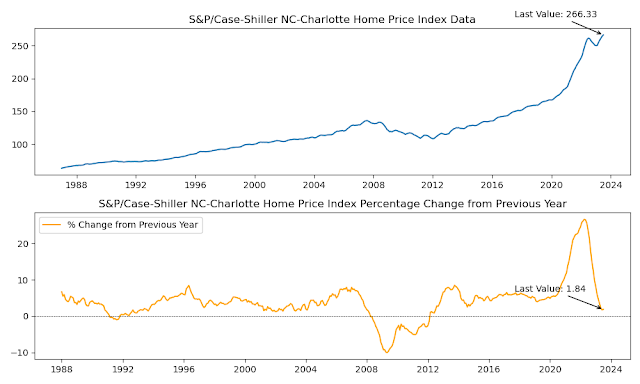
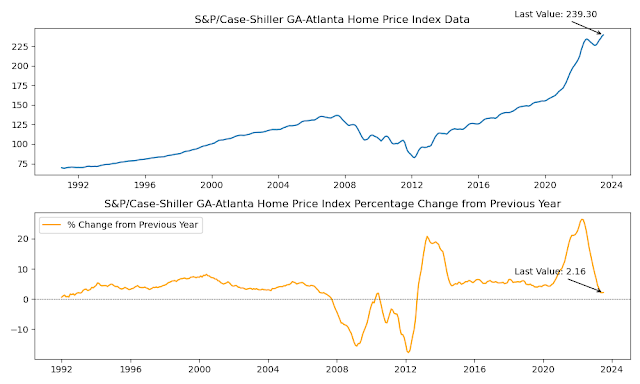
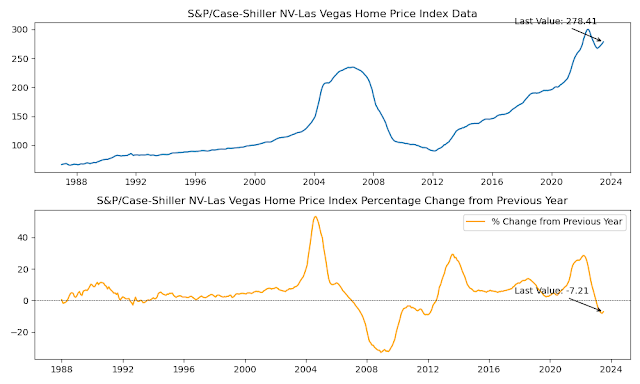
- **Housing Prices & Market Dynamics:** The surge in housing prices, coupled with increasing interest rates and stricter lending standards, might be contributing to the rise in overall housing vacancies and the dip in homeownership rates.
- **Economic Factors:** The recent hikes in interest rates and the strategy of quantitative tightening could be playing a role in the uptick of rental vacancies.
### **4. Implications for the Economy**
- **Housing Prices:** The rise in housing vacancies might exert a downward pressure on housing prices, potentially making homes more affordable for prospective buyers.
- **Economic Stability:** A declining homeownership rate can be a cause for concern. Homeownership has traditionally been a significant driver for wealth accumulation and economic stability. A dip in this rate might indicate potential economic challenges ahead.
In conclusion, while the housing market shows mixed signals, with both positive and negative trends, it's essential for stakeholders, from homeowners to policymakers, to understand these dynamics. By doing so, they can make informed decisions that ensure the continued health and stability of the U.S. housing market.
.png)
.png)
.png)


