The establishment survey data for May provides insights into the changes in nonfarm payroll employment across various industries. Here are the key points summarized from the information:
1. Total nonfarm payroll employment increased by 339,000 in May, which is consistent with the average monthly gain of 341,000 over the previous 12 months.

2. Professional and business services added 64,000 jobs in May, following a similar increase in April. The growth primarily occurred in professional, scientific, and technical services, which added 43,000 jobs.

3. Government employment increased by 56,000 in May, surpassing the average monthly gain of 42,000 over the previous 12 months. However, government employment remains below its pre-pandemic level by 209,000 jobs.

4. Health care added 52,000 jobs in May, in line with the average monthly gain of 50,000 over the previous 12 months. Job growth occurred in ambulatory health care services, hospitals, and nursing and residential care facilities.

5. Employment in leisure and hospitality increased by 48,000 jobs in May, mainly in food services and drinking places. However, the industry is still below its February 2020 level by 349,000 jobs or 2.1 percent.

6. Construction added 25,000 jobs in May, including 11,000 jobs in heavy and civil engineering construction. Over the past 12 months, construction has added an average of 17,000 jobs per month.

7. Employment in transportation and warehousing increased by 24,000 jobs in May, with notable gains in transit and ground passenger transportation, couriers and messengers, and air transportation.

8. Social assistance saw an increase of 22,000 jobs in May, in line with the average monthly gain over the previous 12 months. The growth primarily occurred in individual and family services.

9. Average hourly earnings for all employees on private nonfarm payrolls rose by 11 cents, or 0.3 percent, to $33.44 in May. Over the past 12 months, average hourly earnings have increased by 4.3 percent.

10. The average workweek for all employees on private nonfarm payrolls slightly decreased by 0.1 hour to 34.3 hours in May.

11. The revised data shows an upward revision in employment figures for March and April, indicating a higher combined employment level than previously reported.

These findings provide an overview of employment trends across various sectors in May, highlighting areas of job growth and providing insights into the overall economic landscape.
   Category                                May2022 Mar2023 Apr2023 May2023
1                             Total nonfarm   364.0   217.0   294.0   339.0
2                             Total private   343.0   157.0   253.0   283.0
3                           Goods-producing    61.0   -19.0    28.0    26.0
4                        Mining and logging     2.0     2.0     5.0     3.0
5                              Construction    38.0    -9.0    13.0    25.0
6                             Manufacturing    21.0   -12.0    10.0    -2.0
7                          Durable goods(1)     8.0    -5.0    11.0     3.0
8                  Motor vehicles and parts    -6.4     4.8     9.0     6.8
9                          Nondurable goods    13.0    -7.0    -1.0    -5.0
10                Private service-providing   282.0   176.0   225.0   257.0
11                          Wholesale trade    18.3     3.5     2.4     1.1
12                             Retail trade   -51.4   -18.9    10.0    11.6
13           Transportation and warehousing    45.3    16.2     3.7    24.2
14                                Utilities     0.7     1.7     1.5     0.1
15                              Information    32.0     3.0     1.0    -9.0
16                     Financial activities     6.0    -5.0    25.0    10.0
17    Professional and business services(1)    72.0    45.0    65.0    64.0
18                  Temporary help services     3.6    -3.3    -6.9     7.7
19 Private education and health services(1)    76.0    70.0    85.0    97.0
20        Health care and social assistance    56.9    55.9    69.1    74.6
21                  Leisure and hospitality    73.0    46.0    30.0    48.0
22                           Other services    10.0    14.0     2.0    10.0
23                               Government    21.0    60.0    41.0    56.0
The bar plot below illustrates the changes in employment by sector compared to the previous month, specifically focusing on May 2023. The plot showcases the net employment gains in most sectors, with the exception of the information and manufacturing sectors, which experienced a decrease in employment.

The bar plot presented below depicts the changes from April 2023 and May 2022 in various sectors. It reveals that certain sectors experienced gains in both periods, while others encountered losses.


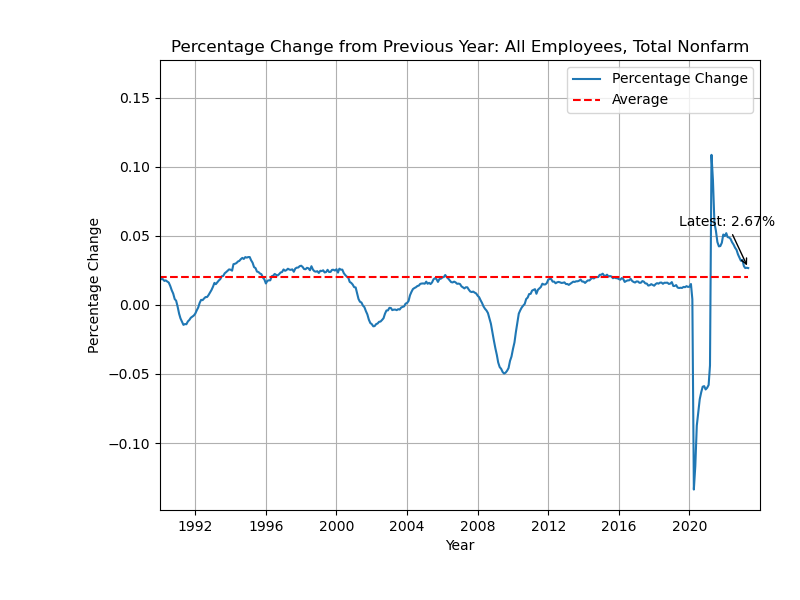
The following charts display the historical percentage changes from the previous year for various sectors. It is evident that the majority of sectors have experienced a slowdown in their percentage changes compared to the previous year. However, a few sectors, namely government, private education, and health services, have shown notable growth in their percentage changes.


No comments:
Post a Comment