S&P/Case-Shiller Home Price Index August 2023
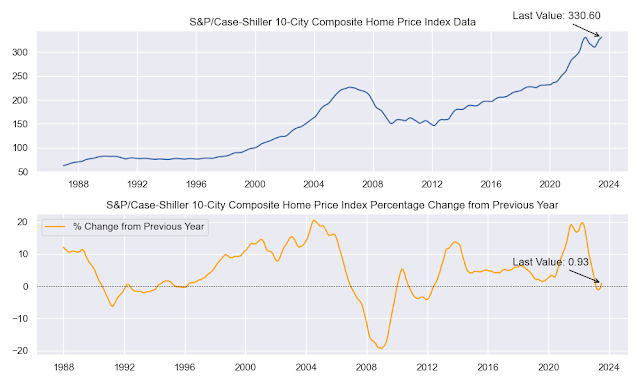
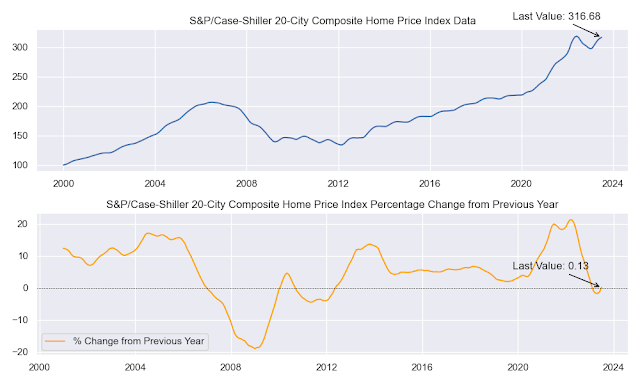
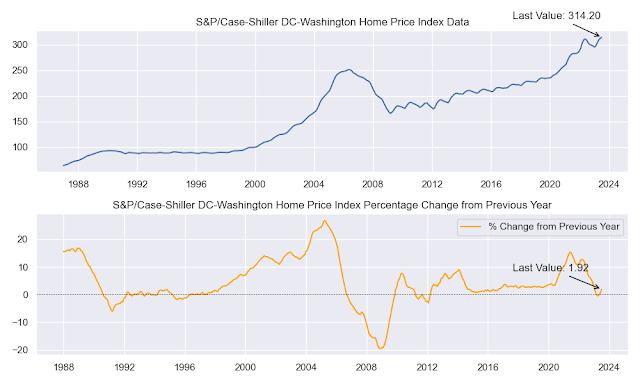
The S&P/Case-Shiller Home Price Index measures the value of single-family homes in 20 major metropolitan areas in the United States. The index is released monthly, with a two-month lag.
The August 2023 S&P/Case-Shiller Home Price Index showed that home prices continued to rise in most markets, but at a slower pace than in previous months. The national index rose 0.98% from July 2023, and 4.73% from August 2022.
The top five markets in terms of year-over-year price growth were:
- Chicago, IL: 4.39%
- Cleveland, OH: 4.04%
- New York, NY: 3.83%
- Detroit, MI: 3.20%
- Atlanta, GA: 2.16%
The bottom five markets in terms of year-over-year price growth were:
- Tampa, FL: -0.76%
- Denver, CO: -2.84%
- Portland, OR: -3.29%
- Dallas, TX: -3.38%
- Seattle, WA: -5.49%
It is important to note that the S&P/Case-Shiller Home Price Index is a lagging indicator, meaning that it reflects price changes that have already occurred. The index does not predict future price movements.
Analysis
The August 2023 S&P/Case-Shiller Home Price Index showed that the housing market is continuing to cool, but at a gradual pace. Home prices are still rising in most markets, but the rate of growth is slowing down. This is likely due to a number of factors, including rising interest rates, inflation, and a tight labor market.
The markets that are seeing the strongest price growth are generally more affordable and have a lower cost of living. The markets that are seeing the weakest price growth are generally more expensive and have a higher cost of living.

Source:https://www.spglobal.com/spdji/en/index-family/indicators/sp-corelogic-case-shiller/sp-corelogic-case-shiller-composite/#overview


No comments:
Post a Comment