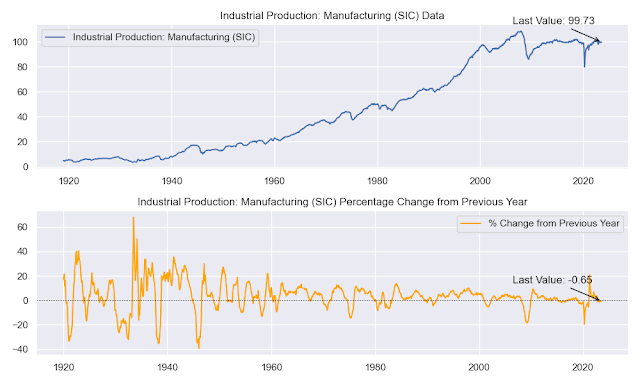
The percentage changes from the previous year for the given indicators are as follows:
- Industrial Production: Total Index: 0.246236 (rounded to 6 decimal places)
- Industrial Production: Manufacturing (SIC): -0.648941 (rounded to 6 decimal places)
- Industrial Production: Manufacturing (NAICS): -0.656313 (rounded to 6 decimal places)
- Capacity Utilization: Total Index: -1.290146 (rounded to 6 decimal places)
- Capacity Utilization: Manufacturing (NAICS): -2.031302 (rounded to 6 decimal places)
This means that the Industrial Production: Total Index increased by 0.246236% from the previous year, while the Industrial Production: Manufacturing (SIC) and Industrial Production: Manufacturing (NAICS) both decreased by 0.648941% and 0.656313%, respectively. Capacity Utilization: Total Index and Capacity Utilization: Manufacturing (NAICS) both decreased by 1.290146% and 2.031302%, respectively.
In other words, the overall industrial production in the United States increased slightly from the previous year, but manufacturing production decreased. Capacity utilization also decreased, meaning that factories are operating below their full potential.
This could be due to a number of factors, such as supply chain disruptions, rising inflation, or a slowdown in economic growth. It is important to note that these are just percentage changes, and it is difficult to draw any conclusions about the overall state of the economy without considering other factors, such as employment and GDP growth.


No comments:
Post a Comment