Yesterday, the stock of NVIDIA (NVDA) experienced a significant spike attributed to the booming field of artificial intelligence (AI). In light of this, I have selected seven prominent semiconductor stocks, namely AMD, NVDA, MU, TSM, INTC, NXPI, QCOM, and AVGO, to conduct a comprehensive analysis of ten key financial measures associated with semiconductor companies. The following charts depict these financial measures for the aforementioned semiconductor companies:
- AMD: Advanced Micro Devices Inc.
- NVDA: NVIDIA Corporation
- MU: Micron Technology Inc.
- TSM: Taiwan Semiconductor Manufacturing Company Limited
- INTC: Intel Corporation
- NXPI: NXP Semiconductors N.V.
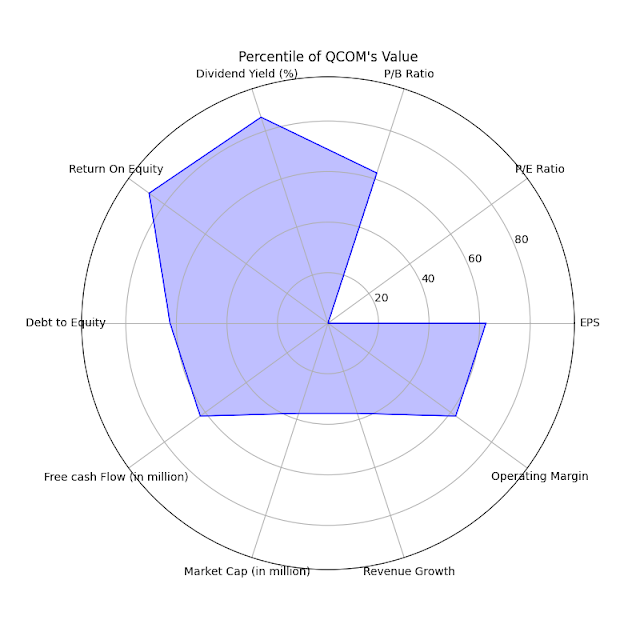
- QCOM: Qualcomm Incorporated
- AVGO: Broadcom Inc.
"The following chart displays the cumulative returns of semiconductor companies. Notably, NVDA (NVIDIA) and AMD (Advanced Micro Devices) lead the cumulative returns, showcasing their strong performance over the given time period. On the other hand, Qualcomm (QCOM) exhibits a negative return, indicating a decline in value during the same period. The chart provides a visual representation of the varying cumulative returns among these semiconductor companies.

These financial measures provide valuable insights into the performance and financial health of the selected semiconductor companies. The EPS, P/E ratio, P/B ratio, dividend yield, ROE, debt to equity, free cash flow, market cap, revenue growth, and operating margin all play crucial roles in assessing a company's profitability, valuation, leverage, and operational efficiency. Analyzing these measures helps investors and analysts make informed decisions when evaluating semiconductor stocks within the rapidly evolving industry.
The table provided presents various financial measures of semiconductor companies. Let's analyze each measure:
1. EPS (Earnings Per Share): EPS represents the company's net earnings divided by the number of outstanding shares. It indicates the profitability per share. For example, AMD has an EPS of 0.19, NVDA has an EPS of 1.74, and MU has an EPS of 1.41.
2. P/E Ratio (Price-to-Earnings Ratio): P/E ratio compares the stock price to the company's earnings per share. It is commonly used to assess the company's valuation. For instance, AMD has a P/E ratio of 639.447, NVDA has a P/E ratio of 217.569, and MU has a P/E ratio of 50.9191.
3. P/B Ratio (Price-to-Book Ratio): P/B ratio compares the stock price to the company's book value per share. It measures the market's valuation of the company relative to its net asset value. For example, AMD has a P/B ratio of 3.57412, NVDA has a P/B ratio of 42.2417, and MU has a P/B ratio of 1.66206.
4. Dividend Yield (%): Dividend yield represents the annual dividend payment as a percentage of the stock's current price. It indicates the return on investment from dividends. For example, NVDA has a dividend yield of 0.05%, MU has a dividend yield of 0.69%, and AVGO has a dividend yield of 2.71%.
5. Return on Equity (ROE): ROE measures the company's profitability in relation to shareholders' equity. It indicates how effectively the company is utilizing shareholders' investments to generate profits. For example, AMD has an ROE of 0.718, NVDA has an ROE of 17.934, and AVGO has an ROE of 55.274.
6. Debt to Equity: Debt to equity ratio compares the company's total debt to shareholders' equity. It reflects the proportion of debt used to finance the company's assets. For example, AMD has a debt to equity ratio of 5.207, NVDA has a debt to equity ratio of 54.436, and AVGO has a debt to equity ratio of 169.009.
7. Free Cash Flow (in million): Free cash flow represents the cash generated by the company after accounting for expenses, investments, and dividends. For example, AMD has a free cash flow of 3762.5 million, NVDA has a free cash flow of 4532.87 million, and AVGO has a free cash flow of 13501.2 million.
8. Market Cap (in million): Market cap is the total market value of a company's outstanding shares. For example, AMD has a market cap of 195,651 million, NVDA has a market cap of 936,253 million, and AVGO has a market cap of 315,774 million.
9. Revenue Growth: Revenue growth represents the percentage change in a company's revenue over a specific period. For example, AMD has a revenue growth of -9.1%, NVDA has a revenue growth of -20.8%, and AVGO has a revenue growth of 15.7%.
10. Operating Margin: Operating margin measures the company's profitability by determining the percentage of revenue remaining after deducting operating expenses. For example, AMD has an operating margin of 0.728, NVDA has an operating margin of 20.675, and AVGO has an operating margin of 44.386.
These financial measures provide insights into the profitability, valuation, financial health, and operational efficiency of semiconductor companies,

The spider charts presented below display the percentiles of financial measures for the seven semiconductor companies. A larger shadow in the chart indicates better financial performance relative to the other semiconductor companies. Therefore, a company with a round shape and a large shadow area represents superior financial performance.


No comments:
Post a Comment