American Express Company (AXP) is a global financial services company headquartered in New York, New York. It offers charge and credit payment card products, as well as travel-related services. The company operates through three segments: Global Consumer Services Group, Global Commercial Services, and Global Merchant and Network Services.
AXP's products and services include payment and financing products, network services, expense management products, travel and lifestyle services, merchant acquisition and processing, fraud prevention services, and customer loyalty programs. It serves consumers, small businesses, mid-sized companies, and large corporations through various channels such as mobile and online applications, third-party vendors, direct mail, telephone, and in-house sales teams.
The company was founded in 1850 and has approximately 77,300 full-time employees. Its key executives include Mr. Stephen Joseph Squeri (Chairman and CEO), Mr. Jeffrey C. Campbell (Vice Chairman and CFO), Mr. Ravikumar Radhakrishnan (Exec. VP and CIO), Mr. Anre D. Williams (CEO of American Express National Bank and Group President of Enterprise Services), Mr. Douglas E. Buckminster (Vice Chairman), Ms. Jessica Lieberman Quinn (Exec. VP, Corp. Controller, and Principal Accounting Officer), Ms. Kerri Bernstein (Head of Investor Relations), Ms. Laureen E. Seeger (Chief Legal Officer), Mr. David B. Nigro (Chief Risk Officer and Head of Global Risk and Compliance), and Ms. Elizabeth Rutledge (Chief Marketing Officer).
In terms of financials, AXP has a market capitalization of $113 billion. Its stock is traded on the NYSE under the symbol AXP. As of the latest data, the stock had a previous close of $148.41 and opened at $149.82. The day's low and high were $149.30 and $152.885, respectively. The company has a dividend rate of $2.40 and a dividend yield of 0.0158. Its trailing price-to-earnings (P/E) ratio is 15.98, and the forward P/E ratio is 12.18. AXP's 52-week range is $130.65 to $182.15.
In terms of governance and risk factors, AXP has moderate risks associated with audit, board, compensation, and shareholder rights. The company has a strong market position, with a significant percentage of institutional ownership. Its profit margins are around 13.87%, and it has shown a consistent dividend payment history.
Analysts have a positive outlook on AXP, with a consensus recommendation of "buy." The target price range is between $146.00 and $220.00, with a mean target price of $183.59. The company has a strong cash position, with total cash of $40.42 billion and total debt of $43.07 billion.
Overall, American Express is a well-established financial services company with a global presence, offering a range of payment and travel-related services.


                 Financial Measure  Percentile Stock
0                           EPS         73.737374
1                     P/E Ratio         26.041667
2                     P/B Ratio         49.450549
3            Dividend Yield (%)         17.857143
4              Return On Equity         69.318182
5                Debt to Equity         68.674699
6   Free cash Flow (in million)          NA
7       Market Cap (in million)         33.000000
8                Revenue Growth         82.474227
9              Operating Margin         39.175258
10                        Total        459.729098
The percentile values comparing the financial measures of American Express Company (AXP) to the financial measures of the S&P 100 stocks are as follows:

1. EPS (Earnings Per Share): AXP's EPS percentile is 73.737374, indicating that AXP's earnings per share performance is higher than approximately 73.74% of the S&P 100 stocks.

2. P/E Ratio (Price to Earnings Ratio): AXP's P/E ratio percentile is 26.041667, suggesting that AXP's valuation, as measured by its P/E ratio, is lower than approximately 26.04% of the S&P 100 stocks.

3. P/B Ratio (Price to Book Ratio): AXP's P/B ratio percentile is 49.450549, implying that AXP's valuation, as measured by its P/B ratio, is higher than approximately 49.45% of the S&P 100 stocks.

4. Dividend Yield (%): AXP's dividend yield percentile is 17.857143, indicating that AXP's dividend yield is higher than approximately 17.86% of the S&P 100 stocks.

5. Return On Equity: AXP's return on equity percentile is 69.318182, suggesting that AXP's profitability, as measured by its return on equity, is higher than approximately 69.32% of the S&P 100 stocks.

6. Debt to Equity: AXP's debt to equity percentile is 68.674699, implying that AXP's level of debt in relation to equity is higher than approximately 68.67% of the S&P 100 stocks.

7. Free Cash Flow (in million dollars): AXP's free cash flow percentile is NA

8. Market Capitalization (in million dollars): AXP's market capitalization percentile is 33.000000, suggesting that AXP's market capitalization is higher than approximately 33% of the S&P 100 stocks.

9. Revenue Growth (%): AXP's revenue growth percentile is 82.474227, implying that AXP's revenue growth rate is higher than approximately 82.47% of the S&P 100 stocks.

10. Operating Margin (%): AXP's operating margin percentile is 39.175258, indicating that AXP's operating margin is higher than approximately 39.18% of the S&P 100 stocks.


These percentile values provide insights into how American Express Company's financial measures compare to a broader group of S&P 100 stocks. It helps investors and analysts understand AXP's relative performance and positioning within the market.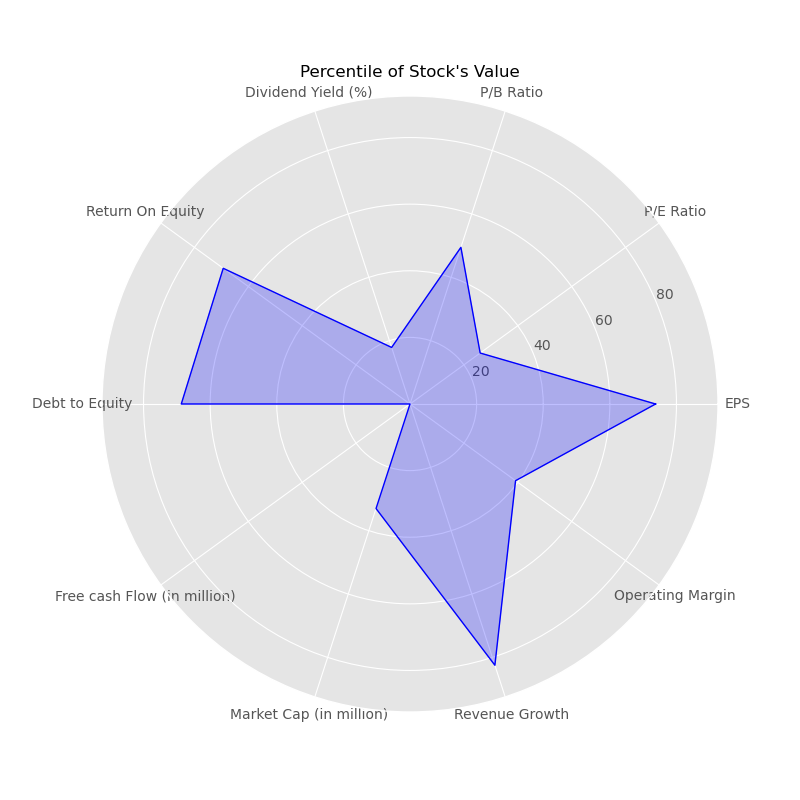
No comments:
Post a Comment