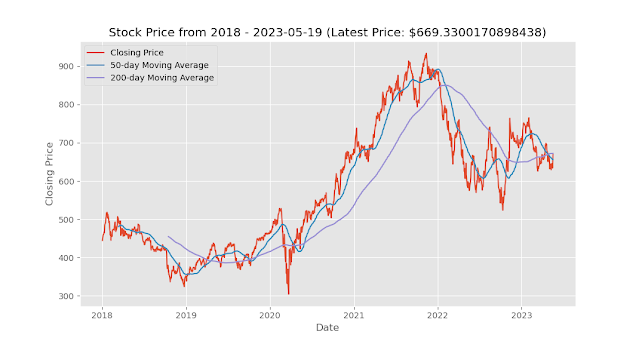
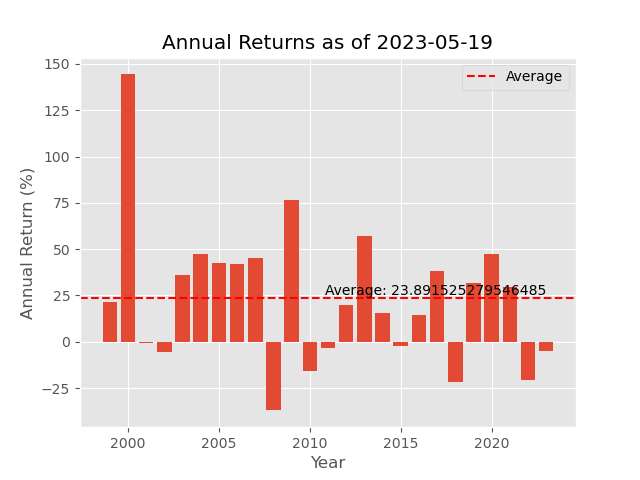
BlackRock, Inc. (BLK) is a publicly owned investment manager based in New York City. It primarily provides its services to institutional, intermediary, and individual investors, including pension plans, insurance companies, mutual funds, governments, and banks. The company offers a wide range of investment products, including equity, fixed income, and balanced portfolios, as well as mutual funds, exchange-traded funds (ETFs), and hedge funds.
BlackRock employs both fundamental and quantitative analysis in its investment strategies, focusing on bottom-up and top-down approaches. It invests globally in various markets, including equities, fixed income, real estate, currencies, commodities, and alternative investments. The company has additional offices in major cities around the world.
As of the last available information, BlackRock had approximately 19,500 full-time employees. The company's leadership team includes Laurence Douglas Fink as Chairman and CEO, Robert Steven Kapito as President and Director, and other senior managing directors.
In terms of financials, BlackRock has a strong market presence with a market capitalization of $100 billion. Its stock symbol is BLK, and it is listed on the New York Stock Exchange (NYSE). The company's stock price has a 52-week range of $503.12 to $785.65. BlackRock has a trailing price-to-earnings (P/E) ratio of 20.74 and a forward P/E ratio of 16.68. It pays a dividend with a yield of 3.07%.
Overall, BlackRock is a leading asset management firm known for its broad range of investment offerings, global presence, and strong financial performance.
Here are some key financial measures for BlackRock, Inc. (BLK):
1. Earnings Per Share (EPS): The EPS for BlackRock is $32.27, which indicates the company's profitability on a per-share basis.
2. Trailing Price-to-Earnings (P/E) Ratio: The trailing P/E ratio for BlackRock is 20.7416, which reflects the company's stock price relative to its earnings.
3. Price-to-Book (P/B) Ratio: The P/B ratio for BlackRock is 2.66058, which compares the company's market value to its book value per share.
4. Dividend Yield: BlackRock has a dividend yield of 3.07%, which represents the annual dividend payout as a percentage of its stock price.
5. Return On Equity (ROE): The ROE for BlackRock is 12.32%, indicating the company's profitability relative to shareholders' equity.
6. Debt-to-Equity Ratio: BlackRock has a debt-to-equity ratio of 21.738, which measures the proportion of debt used to finance the company's assets relative to shareholders' equity.
7. Free Cash Flow: BlackRock's free cash flow is $4,334.37 million, which represents the amount of cash generated by the company's operations after accounting for capital expenditures.
8. Market Capitalization: The market capitalization of BlackRock is $100,241 million, reflecting the total value of the company's outstanding shares in the market.
9. Revenue Growth: BlackRock experienced a revenue growth rate of -9.7%, indicating a decline in its total revenue compared to the previous period.
10. Operating Margin: The operating margin for BlackRock is 35.322%, which measures the company's profitability from its core operations as a percentage of revenue.
11. Forward Price-to-Earnings (P/E) Ratio: The forward P/E ratio for BlackRock is 16.679, which considers the estimated future earnings of the company.
These financial measures provide insights into BlackRock's profitability, valuation, dividend policy, financial health, and market performance.
                   Financial Measure  Percentile Stock
0                           EPS         97.979798
1                     P/E Ratio         43.750000
2                     P/B Ratio         34.065934
3            Dividend Yield (%)         59.523810
4              Return On Equity         32.954545
5                Debt to Equity          8.433735
6   Free cash Flow (in million)         35.294118
7       Market Cap (in million)         27.000000
8                Revenue Growth         11.340206
9              Operating Margin         81.443299
10                        Total        431.785445
To analyze the percentile of BlackRock's financial measures compared to the percentile of S&P 100 stocks, we can examine the provided percentiles for each financial measure:
1. EPS: BlackRock's EPS percentile is 97.979798, indicating that its earnings per share is higher than approximately 97.98% of the S&P 100 stocks.
2. P/E Ratio: BlackRock's P/E ratio percentile is 43.750000, suggesting that its trailing price-to-earnings ratio is lower than approximately 43.75% of the S&P 100 stocks.
3. P/B Ratio: BlackRock's P/B ratio percentile is 34.065934, implying that its price-to-book ratio is lower than approximately 34.07% of the S&P 100 stocks.
4. Dividend Yield (%): BlackRock's dividend yield percentile is 59.523810, indicating that its dividend yield is higher than approximately 59.52% of the S&P 100 stocks.
5. Return On Equity: BlackRock's return on equity percentile is 32.954545, suggesting that its profitability relative to shareholders' equity is higher than approximately 32.95% of the S&P 100 stocks.
6. Debt to Equity Ratio: BlackRock's debt-to-equity ratio percentile is 8.433735, implying that its level of debt relative to equity is lower than approximately 8.43% of the S&P 100 stocks.
7. Free Cash Flow (in million dollars): BlackRock's free cash flow percentile is 35.294118, indicating that its free cash flow is higher than approximately 35.29% of the S&P 100 stocks.
8. Market Capitalization (in million dollars): BlackRock's market capitalization percentile is 27.000000, suggesting that its market value is higher than approximately 27% of the S&P 100 stocks.
9. Revenue Growth (%): BlackRock's revenue growth percentile is 11.340206, indicating that its revenue growth rate is higher than approximately 11.34% of the S&P 100 stocks.
10. Operating Margin (%): BlackRock's operating margin percentile is 81.443299, implying that its profitability from core operations is higher than approximately 81.44% of the S&P 100 stocks.
The "Total" percentile provided as 431.785445 seems to be an aggregated metric, possibly combining the percentiles of the individual measures. It is not clear what this value represents without further context.
Overall, BlackRock appears to have strong financial measures compared to the S&P 100 stocks, with high percentiles in EPS, dividend yield, operating margin, and relatively low percentiles in P/E ratio, P/B ratio, debt-to-equity ratio, and revenue growth. However, it is important to consider the specific industry and market conditions when interpreting these percentiles.


No comments:
Post a Comment