In a world where economic indicators are closely watched for signs of change, the Import Price Index (IPI) serves as a crucial gauge. As of October 2023, the IPI presents a diverse picture across different commodity groups. In this blog, we delve into the latest statistics and what they imply for the economy.
All Commodities: A General Dip
The Import Price Index for All Commodities has seen a decline, with a monthly change of -0.8% and an annual change of -2.0%. This decrease suggests a broad easing of import prices, possibly reflecting global market trends or currency fluctuations.
Excluding Food and Fuels: Subtle Movements
When we exclude food and fuels, the index shows a slight monthly decrease of -0.2%, and an annual drop of -1.3%. This modest change indicates stability in the prices of non-volatile commodities.
Fuels and Lubricants: Marked Decline
A significant decrease is observed in the Fuels and Lubricants category, with a dramatic -6.3% monthly and -11.2% annual change. This sharp decline could be linked to changes in global oil prices or increased energy production efficiencies.
Capital Goods, Except Automotive: Barely Unchanged
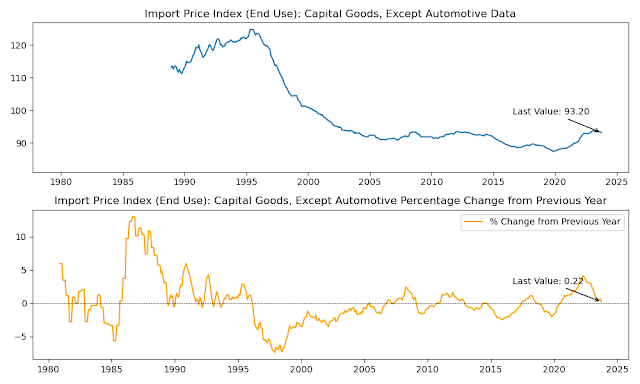
The index for Capital Goods, except automotive, shows an almost negligible monthly decrease of -0.2%, but a slight annual increase of 0.2%. This stability is a positive sign for industries reliant on capital goods, indicating a steady cost environment.
Consumer Goods, Excluding Automotives: Minor Reduction
Consumer goods, excluding automotives, have witnessed a marginal monthly decrease of -0.1% and an annual decrease of -0.3%. This minimal change suggests a stable pricing environment for consumer goods.
Foods, Feeds, and Beverages: Contrasting Trends
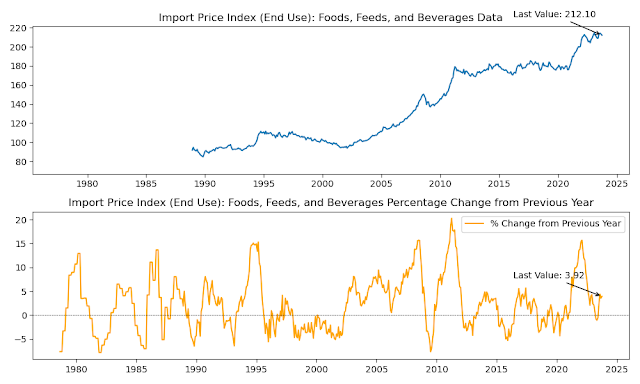
Interestingly, the Foods, Feeds, and Beverages category shows a monthly decrease of -0.6% but an annual increase of 3.9%. This rise over the year could be due to factors like climate change affecting crop yields or changes in global food demand.
Industrial Supplies and Materials: Significant Drop
Industrial Supplies and Materials have experienced a notable monthly decrease of -2.9% and an annual drop of -8.9%. This significant decrease might reflect changes in industrial production or shifts in global supply chains.
Conclusion
The October 2023 Import Price Index highlights varied trends across different commodity groups. While some categories like fuels and industrial supplies show significant declines, others like capital goods and consumer goods remain relatively stable. These patterns are critical for businesses and policymakers, offering insights into global trade dynamics and economic health.
.png)


No comments:
Post a Comment