


library(Quandl)
library(ggplot2)
library(tseries);library(timeseries);library(xts);library(forecast)
library (quantmod)
library(psych)
library(plotly) #install.package(plotly)
#Service-Providing Industries (SRVPRD)
#USGOOD - All Employees: Goods-Producing Industries
#Private Service-Providing (CES0800000001)
#Mining and Logging: Oil and Gas Extraction (CES1021100001)
#Construction (USCONS)
#Manufacturing (MANEMP)
#Durable Goods (DMANEMP)
#Nondurable goods (NDMANEMP)
#Trade, Transportation and Utilities (USTPU)
#Wholesale Trade (USWTRADE)
#Transportation and Warehousing (CES4300000001)
#Retail Trade (USTRADE)
#Utilities (CES4422000001)
#Information Services (USINFO)
#Financial Activities (USFIRE)
#Professional and Business Services (USPBS)
#Education and Health Services (USEHS)
#Leisure and Hospitality (USLAH)
#Other Services (USSERV)
#Government (USGOVT)
getSymbols(c('PAYEMS','USGOOD','SRVPRD','CES0800000001','CES1021100001','USCONS','MANEMP',
'DMANEMP','NDMANEMP','USTPU','USWTRADE','USTRADE','CES4300000001','CES4422000001',
'USINFO','USFIRE','USPBS','USEHS','USLAH','USSERV','USGOVT'), from="1990-01-01",src='FRED')
EMP<-merge (PAYEMS,USGOOD,SRVPRD,CES0800000001,CES1021100001,USCONS,MANEMP,
DMANEMP,NDMANEMP,USTPU,USWTRADE,USTRADE,CES4300000001,CES4422000001,
USINFO,USFIRE,USPBS,USEHS,USLAH,USSERV,USGOVT)
names(EMP)<-c('PAYEMS','USGOOD','SRVPRD','CES0800000001','CES1021100001',
'USCONS','MANEMP','DMANEMP','NDMANEMP','USTPU',
'USWTRADE','USTRADE','CES4300000001','CES4422000001',
'USINFO','USFIRE','USPBS','USEHS','USLAH',
'USSERV','USGOVT')
# % in Total Nonfarm
PER_Good=USGOOD/PAYEMS*100
PER_Service=SRVPRD/PAYEMS*100
PER_CES0800000001=CES0800000001/PAYEMS*100
PER_CES1021100001=CES1021100001/PAYEMS*100
PER_USCONS=USCONS/PAYEMS*100
PER_MANEMP=MANEMP/PAYEMS*100
PER_DMANEMP=DMANEMP/MANEMP*100
PER_NDMANEMP=NDMANEMP/MANEMP*100
PER_USTPU=USTPU/PAYEMS*100
PER_USTRADE=USTRADE/PAYEMS*100
PER_USINFO=USINFO/PAYEMS*100
PER_USPBS=USPBS/PAYEMS*100
PER_USEHS=USEHS/PAYEMS*100
PER_USWTRADE=USWTRADE/PAYEMS*100
PER_USFIRE=USFIRE/PAYEMS*100
PER_USLAH=USLAH/PAYEMS*100
PER_USSERV=USSERV/PAYEMS*100
PER_USGOVT=USGOVT/PAYEMS*100
plot(PER_CES1021100001)
PER_USPBS
summary(PER_USCONS)
hist(PER_USCONS)
# Chart for Total Nonfarm
myColors <- c("red", "darkblue")
plot(x = EMP_PER, xlab = "Year", ylab = "% in Total Nonfarm",
main = "% in Total Nonfarm Employment",col=myColors, screens = 1)
legend(x = "bottom", legend = c('USGOOD','SRVPRD'),
lty = 1, col=myColors)
plot(x = EMP_MAN, xlab = "Year", ylab = "% in Manufacturing",
main = "% in Total Manufacturing Employment",col=myColors, screens = 1)
legend(x = "bottom", legend = c('Durable','NonDurable'),
lty = 1, col=myColors)
write.table(EMP, file='EMP.xls')
myColors <- c("red", "darkblue","brown","yellow","darkred","blue","pink","green","violet","black")
plot(x = last(EMP, "30 years"), xlab = "Year", ylab = "Index",
main = "CPI", col=myColors, screens = 1)
legend(x = "topleft", legend = c('PAYEMS','USGOOD','SRVPRD','CES0800000001','CES1021100001',
'USCONS','MANEMP','DMANEMP','NDMANEMP','USTPU',
'USWTRADE','USTRADE','CES4300000001','CES4422000001',
'USINFO','USFIRE','USPBS','USEHS','USLAH',
'USSERV','USGOVT'),
lty = 1, col=myColors)
Diff_EMP <- (EMP/lag(EMP)-1)
Diff_EMP[1,] <- 0
Diff_EMP12<-diff(EMP,lag =12)
write.table(Diff_EMP, file='Diff_EMP.xls')
tail(Diff_EMP12)
# Retail Trade
par(mfrow=c(3,1))
plot(USTRADE, main="Retail Trade", col="black")
barplot(Diff_EMP12$USTRADE, main="Changes from previous year ", col="red")
barplot(annualReturn(USTRADE), main=" Annual Changes ", col="blue")
# Financial Activities
par(mfrow=c(3,1))
plot(USFIRE, main="Financial Activities", col="black")
barplot(Diff_EMP12$USFIRE, main="Changes from previous year ", col="red")
barplot(annualReturn(USFIRE), main=" Annual Changes ", col="blue")
# Professional and Business Services
par(mfrow=c(3,1))
plot(USPBS, main="Professional and Business Services", col="black")
barplot(Diff_EMP12$USPBS, main="Changes from previous year ", col="red")
barplot(annualReturn(USPBS), main=" Annual Changes ", col="blue")
# Education and Health Services
par(mfrow=c(3,1))
plot(USEHS, main="Education and Health Services", col="black")
barplot(Diff_EMP12$USEHS, main="Changes from previous year ", col="red")
barplot(annualReturn(USEHS), main=" Annual Changes ", col="blue")
# Leisure and Hospitality
par(mfrow=c(3,1))
plot(USLAH, main="Leisure and Hospitality", col="black")
barplot(Diff_EMP12$USLAH, main="Changes from previous year ", col="red")
barplot(annualReturn(USLAH), main=" Annual Changes ", col="blue")
# Other Services
par(mfrow=c(3,1))
plot(USSERV, main="Other Services", col="black")
barplot(Diff_EMP12$USSERV, main="Changes from previous year ", col="red")
barplot(annualReturn(USSERV), main=" Annual Changes ", col="blue")
# US Government
par(mfrow=c(3,1))
plot(USGOVT, main="Government", col="black")
barplot(Diff_EMP12$USGOVT, main="Changes from previous year ", col="red")
barplot(annualReturn(USGOVT), main=" Annual Changes ", col="blue")
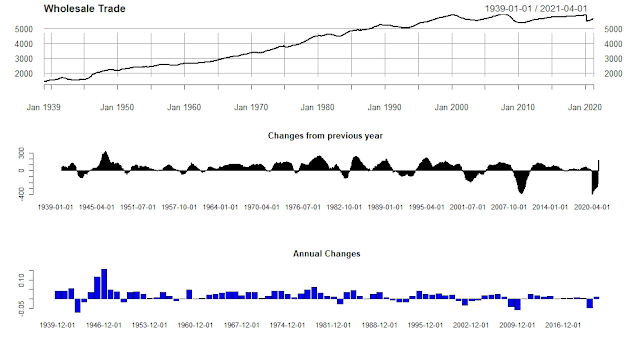
# Wholesale Trade
par(mfrow=c(3,1))
plot(USWTRADE, main="Wholesale Trade", col="black")
barplot(Diff_EMP12$USWTRADE, main="Changes from previous year ", col="red")
barplot(annualReturn(USWTRADE), main=" Annual Changes ", col="blue")
# Mining and Logging: Oil and Gas Extraction
par(mfrow=c(3,1))
plot(CES1021100001, main="Mining and Logging: Oil and Gas Extraction", col="black")
barplot(Diff_EMP12$CES1021100001, main="Changes from previous year ", col="red")
barplot(annualReturn(CES1021100001), main=" Annual Changes ", col="blue")
No comments:
Post a Comment