Translate

Thursday, September 28, 2023

The Velocity of M2 Money Stock (M2V) and the Velocity of M1 Money Stock (M1V)

 The Velocity of M2 Money Stock (M2V) and the Velocity of M1 Money Stock (M1V) are economic indicators that measure the frequency at which currency is used to buy goods and services within a given time period. M2V is calculated by dividing quarterly nominal GDP by the quarterly average of M2 money stock, while M1V is calculated similarly using M1 money stock.


These indicators help gauge economic activity. If the velocity of money is increasing, it suggests that more transactions are happening within the economy. It can also provide insights into whether people are saving or spending money.


The money supply has several components, including M1, M2, and MZM. M1 includes currency in circulation, demand deposits, and other liquid deposits. M2 is broader and includes M1 plus savings deposits, certificates of deposit, and money market deposits for individuals. MZM is the broadest component, encompassing various financial assets.


Comparing the velocities of M1 and M2 can reveal how quickly the economy is spending and saving. MZM's velocity helps determine the frequency of financial asset exchanges in the economy.


These indicators are useful for understanding economic trends and can be found on the Federal Reserve Bank of St. Louis website.


Wednesday, September 27, 2023

International Investment Position 2nd Quarter 2023

The U.S. net international investment position (IIP) measures the financial gap between the total value of U.S. assets abroad and foreign assets in the United States, offering insight into the nation's global financial standing. Key data points in the provided information include: (all figures are in millions dollars)

1. **IIPUSNETIQ (-17997673.0):** The U.S. IIP, denoting a negative value, indicates that the U.S. owes more to foreigners than foreigners owe to the U.S.

2. **IIPUSASSQ (33578193.0):** This represents the total value of U.S. assets located abroad.

3. **IIPPORTLQ (26814548.0):** Signifies the value of U.S. portfolio investments abroad, encompassing foreign holdings of U.S. stocks and bonds.

4. **IIPNETINQ (-18025332.0):** The U.S. IIP excluding financial derivatives, which are contracts derived from underlying assets like stocks or bonds.

5. **IIPFINAAGQ (2482845.0):** The value of U.S. financial derivatives, excluding reserve assets.

6. **IIPDIRELMVQ (14001755.0):** Represents the value of U.S. direct investment at market value, covering foreign investments in U.S. businesses and U.S. investments in foreign businesses.

7. **IIPPORTAQ (14826957.0):** Signifies the value of U.S. portfolio investment at market value.

8. **IIPDIREAMVQ (10304630.0):** The value of U.S. direct investment at market value, excluding financial derivatives.

9. **IIPRESEQ (732923.0):** Corresponds to the value of U.S. reserve assets, held by central banks and monetary authorities to support currency value.

10. **IIPOTHELQ (8304378.0):** Denotes the value of U.S. other investments, including currency, deposits, trade credit, and loans.

11. **IIPLIABQ (49120680.0):** Represents the value of U.S. liabilities to foreigners, indicating total U.S. debt owed to foreign entities.

12. **IIPASSEQ (31095348.0):** Reflects the value of U.S. assets, excluding financial derivatives.

13. **IIPOTHEAQ (5230838.0):** The value of U.S. other investments at market value.

14. **IIPUSLIAQ (51575866.0):** Signifies the value of U.S. liabilities, excluding financial derivatives, which includes foreign debt owed to the U.S.

15. **IIPFINANCNQ (27659.0):** The value of U.S. financial derivatives (excluding reserve assets) in net terms.

16. **IIPFINALGQ (2455186.0):** Corresponds to the value of U.S. financial derivatives (excluding reserve assets) in gross terms.

In summary, the U.S. has a negative net international investment position, indicating a higher debt owed to foreign entities. However, substantial holdings of U.S. assets abroad, including portfolio and direct investments, highlight the intricacies of the U.S.'s financial relationships with the rest of the world.


.


Source: https://www.bea.gov/data/intl-trade-investment/international-investment-position

Coincident Economic Activity Index as of August 2023


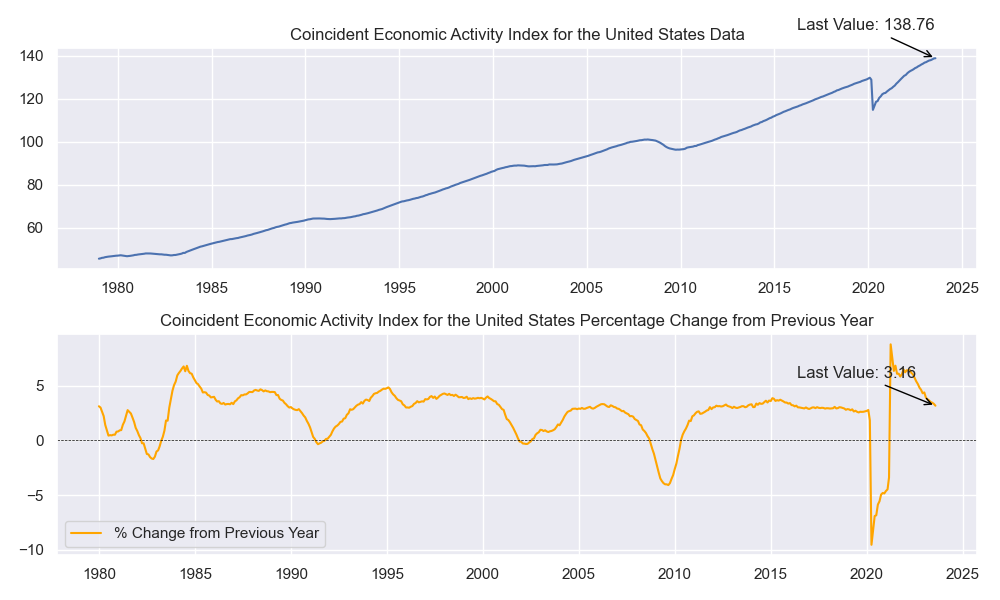
The Coincident Economic Activity Index (CEAI) is a composite index that gauges the current state of the economy. It relies on four key indicators: nonfarm payroll employment, average manufacturing hours worked, unemployment rate, and inflation-adjusted wage and salary disbursements. For the United States as a whole, the CEAI stands at 3.159616, indicating modest economic growth. However, there is substantial variation in economic activity among states.


The top 5 states with the highest CEAI growth are Massachusetts (7.757462), Maryland (7.681736), Washington (4.286088), Pennsylvania (4.144536), and Arizona (3.847084). These states are witnessing strong job growth, low unemployment, and are home to high-growth industries like technology, healthcare, and finance.


Conversely, the bottom 5 states with the lowest CEAI growth are New Jersey (0.251461), New York (1.931526), California (1.573285), Illinois (2.630558), and Michigan (2.792800). These states are experiencing slower job growth, higher unemployment, and face economic challenges such as high taxes and regulatory burdens.


It's essential to remember that the CEAI is just one measure of economic activity, and other factors like GDP growth and personal income growth should also be considered when assessing the overall economic health. Nonetheless, the CEAI is a valuable tool for identifying states experiencing economic growth and those facing economic challenges.


Tuesday, September 26, 2023

S&P/Case-Shiller Home Price Indices as of August 2023

S&P/Case-Shiller Home Price Index August 2023

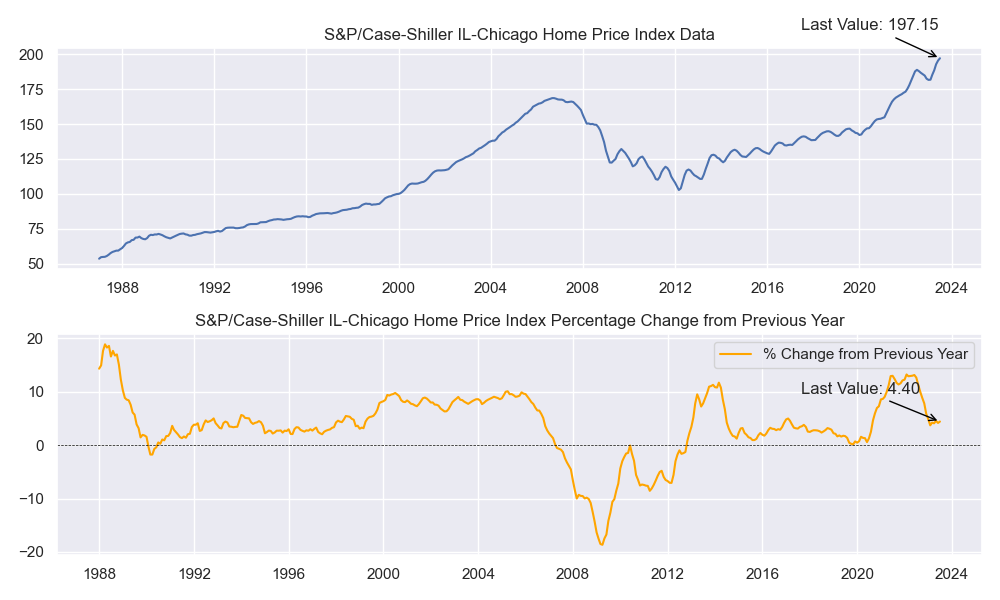
The S&P/Case-Shiller Home Price Index measures the value of single-family homes in 20 major metropolitan areas in the United States. The index is released monthly, with a two-month lag.

The August 2023 S&P/Case-Shiller Home Price Index showed that home prices continued to rise in most markets, but at a slower pace than in previous months. The national index rose 0.98% from July 2023, and 4.73% from August 2022.

The top five markets in terms of year-over-year price growth were:

  1. Chicago, IL: 4.39%
  2. Cleveland, OH: 4.04%
  3. New York, NY: 3.83%
  4. Detroit, MI: 3.20%
  5. Atlanta, GA: 2.16%

The bottom five markets in terms of year-over-year price growth were:

  1. Tampa, FL: -0.76%
  2. Denver, CO: -2.84%
  3. Portland, OR: -3.29%
  4. Dallas, TX: -3.38%
  5. Seattle, WA: -5.49%

It is important to note that the S&P/Case-Shiller Home Price Index is a lagging indicator, meaning that it reflects price changes that have already occurred. The index does not predict future price movements.

Analysis

The August 2023 S&P/Case-Shiller Home Price Index showed that the housing market is continuing to cool, but at a gradual pace. Home prices are still rising in most markets, but the rate of growth is slowing down. This is likely due to a number of factors, including rising interest rates, inflation, and a tight labor market.

The markets that are seeing the strongest price growth are generally more affordable and have a lower cost of living. The markets that are seeing the weakest price growth are generally more expensive and have a higher cost of living.

It is unclear how the housing market will perform in the coming months. However, it is likely that home price growth will continue to slow down, and some markets may even see price declines.


Source:https://www.spglobal.com/spdji/en/index-family/indicators/sp-corelogic-case-shiller/sp-corelogic-case-shiller-composite/#overview