My objective is to simplify and clarify economics, making it accessible to everyone. It is important to remember that the opinions expressed in my writing are solely my own and should not be considered as financial advice. Any potential losses incurred from acting upon the information provided in my writing are the responsibility of the individual, and I cannot be held liable for them.
Translate
Tuesday, August 22, 2017
Sunday, August 20, 2017
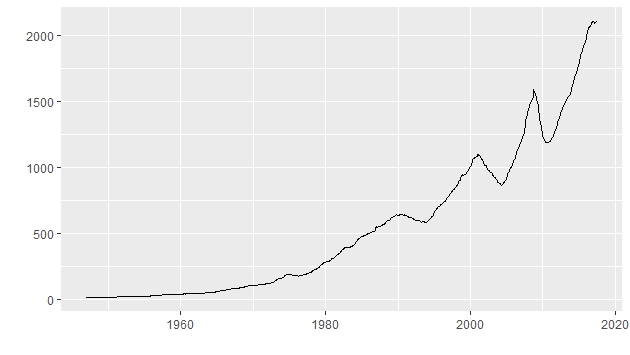
Commercial and Industrial Loans as of July 2017
Commercial and Industrial Loans
Commercial and Industrial Loans from previous month
Industrial and Commercial loans from previous year
Source: https://fred.stlouisfed.org/series/BUSLOANS#0
Saturday, August 19, 2017
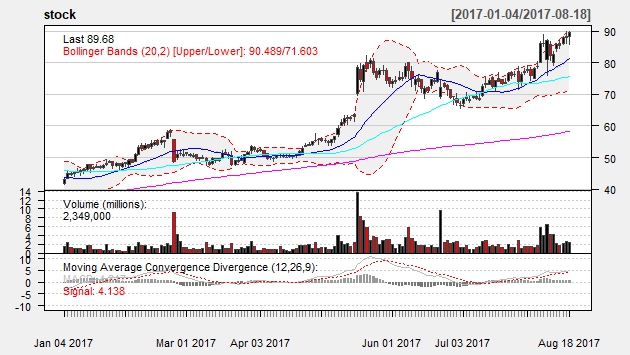
Weibo Stock
요즈음 중국 IT 기업들의 주가가 미국의 FAANG (Facebook, Apple, Amazon, Netflix and Google) 보다 더 잘나가고 있습니다. 그중에 하나가 웨이보기업 (Weibo) 인데 작년까지 불가 $20 내외였는데 현재 $90 가까이 상승했습니다. 거의 4배가 올랐습니다.
Friday, August 18, 2017
Industrial Production Index (INDPRO)
library(zoo)
library(quantmod)
library(TTR)
library(forecast)
library(ggfortify)
library(psych)
library(pastecs)
library(xts)
getSymbols('INDPRO', src='FRED')
mydata=INDPRO
Annual<-annualReturn(mydata)*100
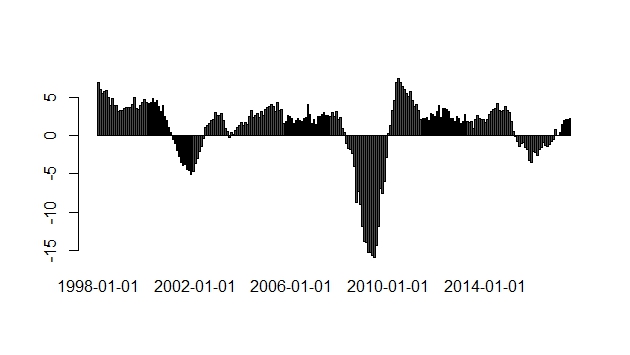
barplot(last(Annual, '20 year'), main='Annual Changes')
tail(Annual)
yearly.returns
2012-12-01 2.3161888
2013-12-01 2.0991660
2014-12-01 3.1831880
2015-12-01 -3.2541923
2016-12-01 0.8255124
2017-07-01 1.6461802 (as of July 2017)
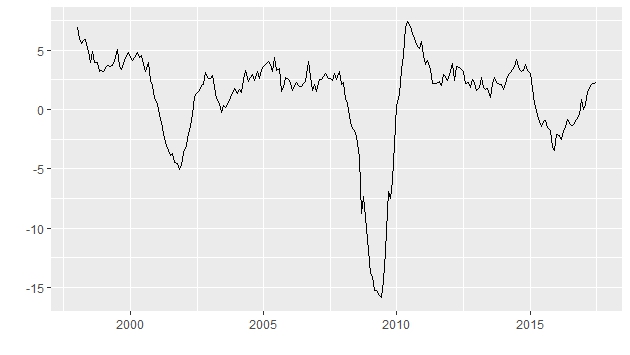
# Annual changes from 1998 to July 2017
the industrial production index increased by 1.65% in 2017 as of July 2017.
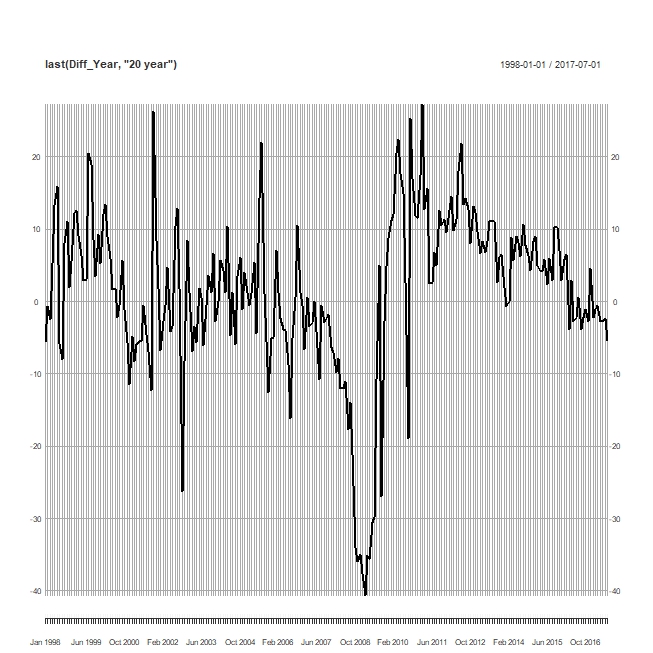
Diff_Year=diff(mydata,lag=12)
barplot(last(Diff_Year, '20 year'))
Industrial production index begins to increase positively from January 2017.
autoplot(last(Diff_Year, '20 year'))
summary(last(Diff_Year, '20 year'))
Index INDPRO
Min. :1998-01-01 Min. :-15.8834
1st Qu.:2002-11-16 1st Qu.: 0.0678
Median :2007-10-01 Median : 2.2094
Mean :2007-10-01 Mean : 1.0568
3rd Qu.:2012-08-16 3rd Qu.: 3.3462
Max. :2017-07-01 Max. : 7.4406
#forecasting
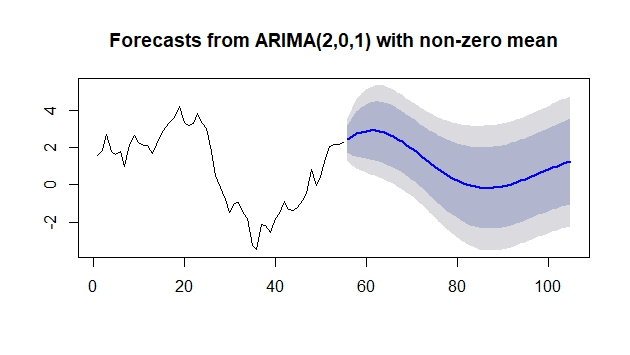
fit<-arima(last(Diff_Year, '5 year'), order=c(2,0,1))
accuracy(fit)
forecast(fit,50)
plot(forecast(fit,50))
Thursday, August 17, 2017
Emerging Stock Markets Leverage 3X ETFs
The emerging stock markets:
EDC (Direxion Daily MSCI Em Mkts Bull 3X ETF (EDC))
RUSL (Direxion Daily Russia Bull 3X Shares(RUSL))
YINN (Direxion Daily FTSE China Bull 3X ETF (YINN))
BRZU (Direxion Daily MSCI Brazil Bull 3X ETF (BRZU))
INDL (Direxion Daily MSCI India Bull 3X Shares )
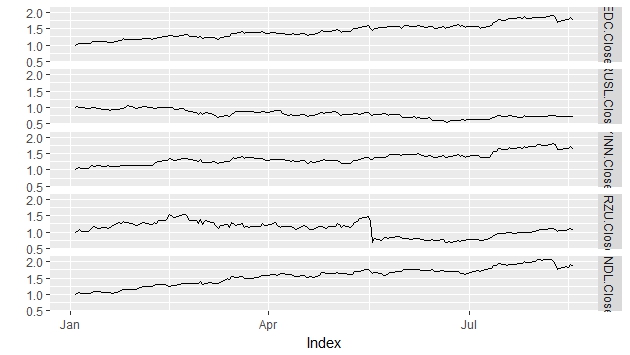
If you have invested $1.00 at the beginning of year, then the returns would be following: India would the highest yield among emerging countries.
EDC.Close RUSL.Close YINN.Close BRZU.Close INDL.Close
2017-08-10 1.703108 0.7183414 1.611931 1.011147 1.752255
2017-08-11 1.720110 0.7172208 1.619628 1.040188 1.789659
2017-08-14 1.772395 0.7162869 1.661963 1.044881 1.859186
2017-08-15 1.775503 0.7209563 1.651058 1.077442 1.839824
2017-08-16 1.831810 0.7293612 1.724182 1.117630 1.914631
2017-08-17 1.758318 0.7259993 1.622835 1.058082 1.853685
Subscribe to:
Posts (Atom)