library(zoo)
library(quantmod)
library(TTR)
library(forecast)
library(ggfortify)
library(psych)
library(pastecs)
library(xts)
getSymbols('INDPRO', src='FRED')
mydata=INDPRO
Annual<-annualReturn(mydata)*100
barplot(last(Annual, '20 year'), main='Annual Changes')
tail(Annual)
yearly.returns
2012-12-01 2.3161888
2013-12-01 2.0991660
2014-12-01 3.1831880
2015-12-01 -3.2541923
2016-12-01 0.8255124
2017-07-01 1.6461802 (as of July 2017)
# Annual changes from 1998 to July 2017
the industrial production index increased by 1.65% in 2017 as of July 2017.
Diff_Year=diff(mydata,lag=12)
barplot(last(Diff_Year, '20 year'))
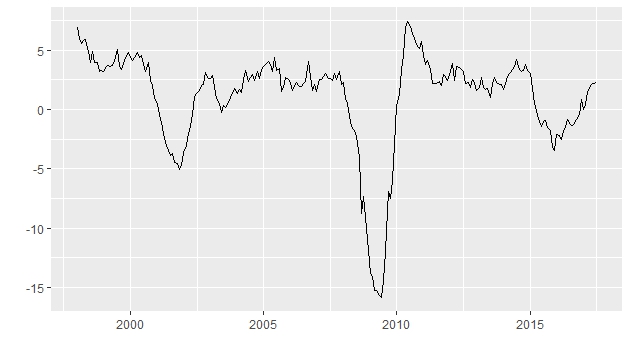
Industrial production index begins to increase positively from January 2017.
autoplot(last(Diff_Year, '20 year'))
summary(last(Diff_Year, '20 year'))
Index INDPRO
Min. :1998-01-01 Min. :-15.8834
1st Qu.:2002-11-16 1st Qu.: 0.0678
Median :2007-10-01 Median : 2.2094
Mean :2007-10-01 Mean : 1.0568
3rd Qu.:2012-08-16 3rd Qu.: 3.3462
Max. :2017-07-01 Max. : 7.4406
#forecasting
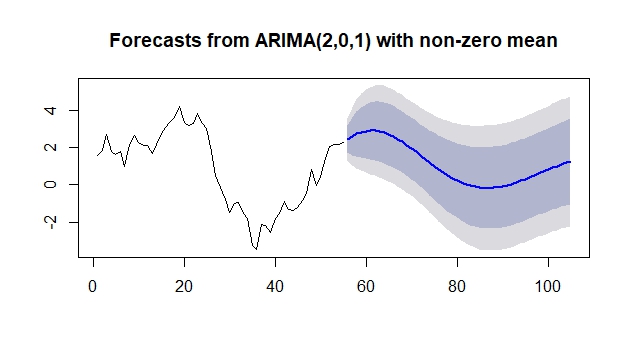
fit<-arima(last(Diff_Year, '5 year'), order=c(2,0,1))
accuracy(fit)
forecast(fit,50)
plot(forecast(fit,50))


No comments:
Post a Comment