South Korea’s Valuation Discount vs Global and Regional Markets
Summary: South Korea’s stock market continues to trade at a significant valuation discount compared to global averages and peer countries. As of mid-2025, Korean equities (measured by the MSCI Korea Index/KOSPI) have a trailing price-to-earnings (P/E) ratio around 9.8, which is less than half of the global market’s ~22 and the U.S.’s ~27. Similarly, Korea’s price-to-book (P/B) ratio is roughly 0.99, dramatically lower than ~3.2 globally and ~4.9 in the U.S.. Comparisons with regional peers tell the same story – Korea trades at a 30–50% discount to Japan, China, and Taiwan on both P/E and P/B metrics. The table below quantifies Korea’s valuation discount (% below each benchmark) alongside the absolute ratios. These discounts reflect longstanding issues often termed the “Korea Discount.” We also discuss key reasons for this discount – ranging from geopolitical risk to corporate governance and shareholder returns – and recent efforts to narrow the gap.
Current Valuations: South Korea vs Global and Peers
Using the latest available data (mid-2025), South Korea’s stock market is valued far lower than global indices and specific peer countries on both earnings and book value measures. Table 1 summarizes the trailing P/E and P/B ratios for South Korea, the global market (MSCI World/ACWI), United States, Japan, China, and Taiwan, along with the percentage difference indicating how much cheaper (or more expensive) Korea is relative to each benchmark:
| Benchmark |
P/E Ratio (Korea vs Benchmark) |
Korea’s P/E Discount |
P/B Ratio (Korea vs Benchmark) |
Korea’s P/B Discount |
| Global (MSCI World) |
9.8 vs 22.3 |
−55.9% (cheaper) |
1.0 vs 3.2 |
−68.9% (cheaper) |
| USA (S&P 500) |
9.8 vs 26.9 |
−63.5% (cheaper) |
1.0 vs 4.9 |
−79.6% (cheaper) |
| Japan (MSCI Japan) |
9.8 vs 15.8 |
−37.9% (cheaper) |
1.0 vs 1.5 |
−35.3% (cheaper) |
| China (MSCI China) |
9.8 vs 14.7 |
−32.9% (cheaper) |
1.0 vs 1.8 |
−45.0% (cheaper) |
| Taiwan (MSCI Taiwan) |
9.8 vs 15.9 |
−38.1% (cheaper) |
1.0 vs 2.0 |
−51.2% (cheaper) |
Table 1: South Korea’s valuation ratios vs benchmarks, and the percentage discount of Korea relative to each (negative values indicate how much lower Korea’s ratio is). All figures are the most recent trailing 12-month values (as of around June 2025). South Korea’s P/E of ~9.8 and P/B of ~0.99 are significantly lower than those of global equities and the selected countries, confirming a large valuation gap. For example, Korea trades nearly 56% below global markets on P/E and about 69% below on P/B. Against the U.S., the discount is even larger – on a P/B basis Korea is almost 80% cheaper than the S&P 500. Even compared to its regional peers (Japan, China, Taiwan), Korea’s stock market is valued roughly one-third to one-half lower by these metrics.
In absolute terms, South Korea’s P/E (~9.8) is only about half to two-thirds of the P/E ratios in Japan (~15.8), China (~14.7), and Taiwan (~15.9). Its P/B (~0.99) is strikingly low – below 1, meaning the market capitalization of Korean stocks is less than their book value – whereas Japan is ~1.5, China ~1.8, and Taiwan ~2.0–2.1. (In fact, a majority of KOSPI-listed companies trade at P/B < 1, an indicator of how pervasive the discount is.) By comparison, global developed markets trade at about 3 times book and the U.S. around 4.8–5 times book, underscoring how extreme Korea’s undervaluation appears on a relative basis.
It’s worth noting these are trailing valuation metrics. Forward-looking multiples tell a similar story: for instance, Samsung Electronics (the largest Korean stock) sells for ~9.2× expected earnings, barely half the ~18.5× of its peer TSMC in Taiwan. Thus, by any measure, Korean equities are priced at a substantial discount to both global averages and specific markets like the U.S., Japan, China, and Taiwan.
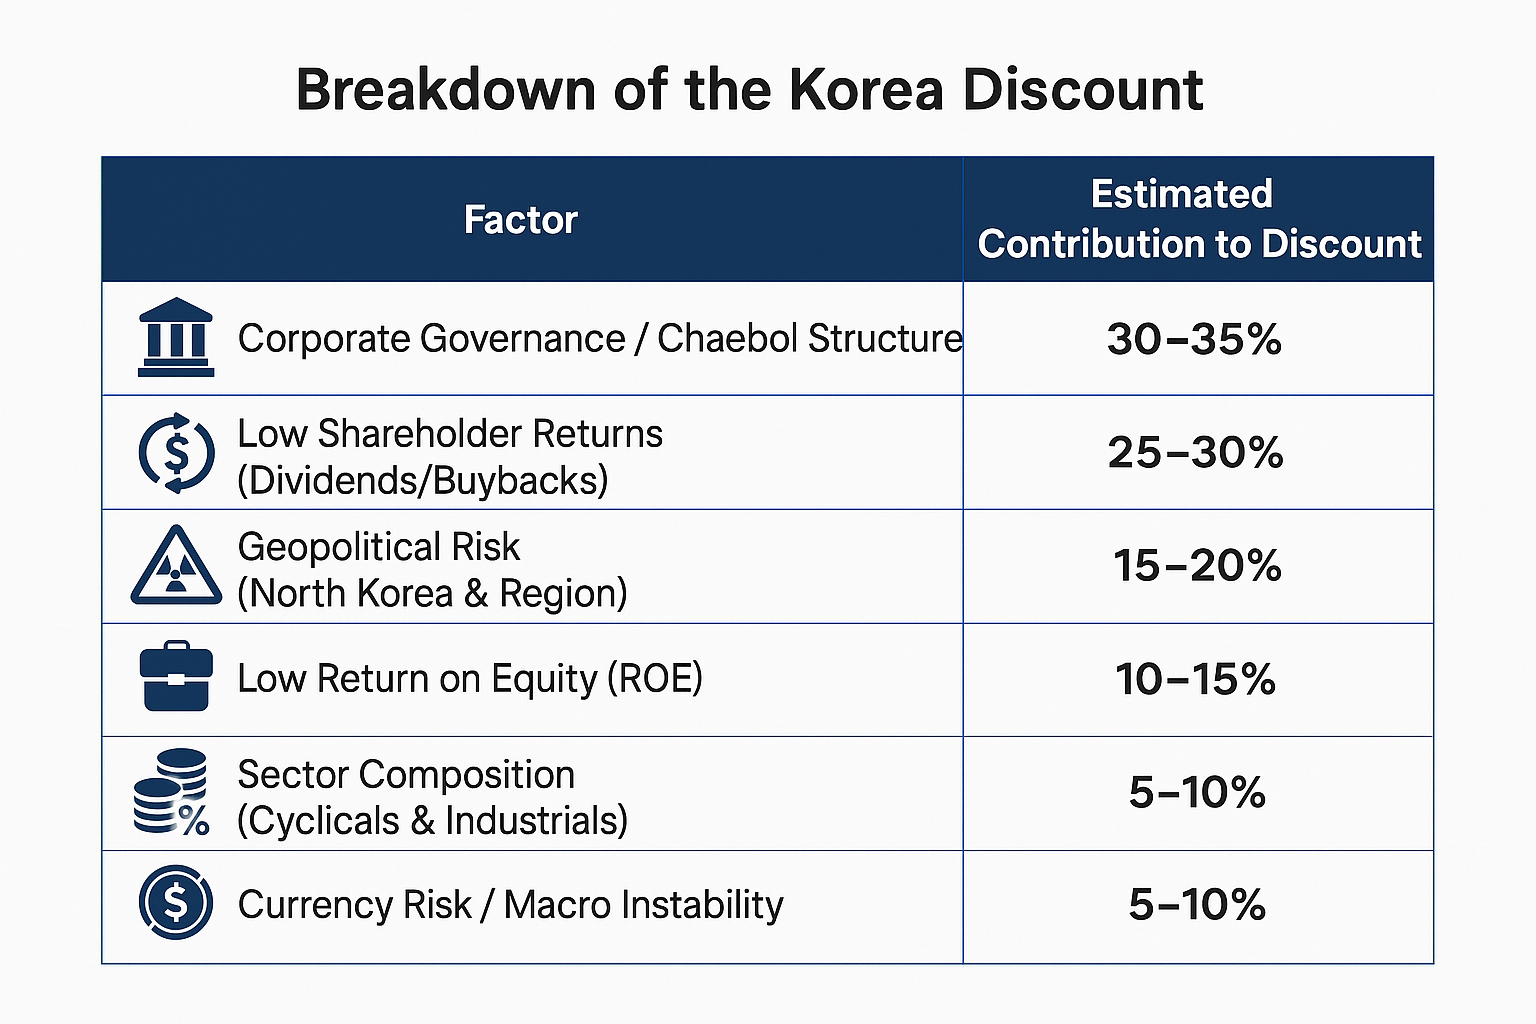
Why Does the “Korea Discount” Exist?
South Korea’s persistent valuation gap – often referred to as the “Korea Discount” – has been well-documented. In essence, Korean companies trade at lower multiples even when their earnings and book values are comparable to international peers. Several key factors have been identified by analysts and investors to explain this phenomenon:
-
Geopolitical Risk: The overhang of North Korea is frequently cited as a risk factor that investors demand compensation for. Periodic spikes in tension reinforce a higher risk premium on Korean assets. For example, political shocks (like the surprise martial-law scare in late 2024) remind investors of geopolitical instability, contributing to the discount. South Korea’s proximity to potential conflict and geopolitical uncertainty (including relations with China) make global investors more cautious, lowering valuations.
-
Corporate Governance and Chaebol Structure: South Korea’s economy is dominated by family-controlled conglomerates (chaebols), and historically these firms have had opaque governance and have been less friendly to minority shareholders. Issues include limited shareholder rights, cross-shareholding structures, and a tendency to prioritize family control over shareholder returns. Crucially, Korean companies have seldom paid generous dividends or engaged in large buybacks. In 2021, South Korea’s aggregate dividend payout ratio was just ~19% of earnings – the lowest among major markets. (By contrast, Taiwan’s payout was about 55%, and developed markets like the US/Europe were ~35–40%.) This low return of profits to shareholders has depressed investor sentiment and justified lower valuations. Simply put, global investors are unwilling to pay high multiples for companies that hoard cash or invest in empire-building rather than returning capital to shareholders.
-
Low Return on Equity (ROE): Related to the above, Korean firms have generally exhibited lower profitability relative to their equity. Structural factors like the conglomerate model and conservative balance sheets contribute to a lower ROE, which in turn merits lower P/B ratios. Empirical research by the Korea Capital Market Institute found that low ROE and poor shareholder returns are significant drivers of the Korea discount. Many Korean companies sitting on large asset bases (property, cash, etc.) but not earning commensurate profits end up trading below book value – as evidenced by the majority of KOSPI firms with P/B under 1.
-
Market Composition – Cyclical Sector Bias: The Korean market’s sector makeup skews toward hardware technology, manufacturing, and heavy industries (e.g. semiconductors, shipbuilding, autos) which often trade at lower multiples. Unlike the U.S. market which is rich in high-growth tech and services commanding premium P/Es, Korea’s big companies are more cyclically sensitive. During down-cycles (e.g. memory chip downturns), earnings can dip and drag trailing P/Es higher, but investors price in those cyclical swings by keeping valuations low. This partially explains why Korea’s average P/E (2014–2023 was ~12.2) has consistently lagged peers – about 19% below Taiwan’s and 28% below Japan’s average P/E over that period. In short, Korea has traditionally been treated as a “value” or cyclical market, deserving lower multiples.
-
Currency and Macro Factors: Foreign investors also factor in currency risk (the Korean won can be volatile). Episodes of capital outflow put pressure on the won and local asset prices. In 2023–2024, for instance, Korea saw significant foreign equity outflows amid a strong dollar and concerns about China’s economy, which Korea is heavily exposed to. A weaker currency and external vulnerabilities can amplify the discount, as global funds demand a margin of safety to compensate for macro risk.
These factors combined have entrenched the Korea Discount for years. As Reuters noted, “Global investors have always valued South Korea below other markets” due to everything from North Korea tensions to chaebol dominance. The result is evident in valuations: at the end of 2023, MSCI Korea’s P/B was just 1.1×, which was 58% of the average developed-market P/B, and far below markets like Taiwan (2.4×) or the MSCI World index (~3.5×). In effect, investors apply a conglomerate and country risk discount to Korean equities, keeping prices low relative to fundamentals.
Recent Developments and Outlook
There is growing recognition in Korea of this valuation gap and its negative implications (e.g. for corporate financing costs and the national pension’s performance). In response, Korean authorities and market participants have started initiatives to unlock value and narrow the discount:
-
“Value-Up” Reform Proposal: In 2023, the Financial Services Commission (FSC) and Korea Exchange began promoting reforms to encourage re-rating of Korean stocks. A notable proposal, nicknamed the “Value-Up plan,” targets companies trading below book value (P/B < 1). Under this plan, regulators would publish key metrics like P/B and ROE for all listed firms and press those with sub-1 P/B to outline plans for improving corporate value. This initiative mirrors steps taken by Japan’s stock exchange, which prodded low-P/B Japanese firms to take action and has been credited with helping lift the TOPIX/Nikkei to multi-decade highs in 2023. Korea’s hope is that similar transparency and gentle pressure will catalyze higher dividends, buybacks, or business restructurings to boost valuations.
-
Shareholder-Friendly Moves: Korean companies have slowly begun to increase dividend payouts and share repurchases in light of investor demands. The government has also considered tax and policy changes to incentivize higher distributions. President Yoon’s administration, for example, has floated ideas like easing the historically high inheritance taxes that force chaebol families to conserve ownership (a factor cited as discouraging external shareholder value maximization). There have also been discussions about extending a ban on short-selling and other market stabilization measures to improve investor confidence. While controversial, these actions signal that authorities are prioritizing market performance and could gradually improve the investment climate.
-
Improving Fundamentals: It’s worth noting that some factors behind the discount have been improving. Corporate governance practices are slowly aligning with global standards; several chaebols have unwound cross-holdings and increased independent oversight in recent years. Korea’s economy also remains robust and innovative (with world-leading tech companies, automakers, etc.), so if global investors pivot more to fundamentals, the deep valuation gap could attract value investors. Indeed, some asset managers see opportunity: at the start of 2024, Robeco and others announced overweight positions in Korea, arguing that steps to address the discount (and Korea’s exposure to high-growth themes like EVs, batteries, and AI) will eventually reward investors.
In summary, South Korea’s equity market currently trades at a substantial discount to global and regional benchmarks – roughly 30–80% cheaper by P/E or P/B, depending on the comparison. This discount has been persistent, rooted in structural issues (geopolitical risk, corporate governance, low shareholder returns, and sector mix) that have long made investors wary. The consequence is that many Korean stocks are valued extremely low relative to peers – e.g. trading below book value or at single-digit earnings multiples – despite comparable business metrics. Recent reforms and market pressure are aimed at closing this gap. If Korea can improve corporate transparency, raise ROE via better capital returns, and allay investor concerns, there is potential for the valuation gap to narrow over time. For now, however, the “Korea Discount” remains in place – clearly visible in the numbers above and a key factor in any analysis of Korean equities.
Sources: Key data was drawn from MSCI index metrics and ETF fact sheets (for the latest P/E, P/B ratios), as well as analyses by Reuters and investment firms highlighting the Korea discount and its causes. These sources are cited throughout for reference. The valuation ratios are as of mid-2025, and the discount calculations were computed based on those figures. Historical context and reasons behind the discount were summarized from Reuters, Robeco, and academic research as cited. The consistency of findings across these sources reinforces the conclusion that South Korea’s market is fundamentally undervalued relative to global peers, barring a change in the underlying risk factors and market practices.