Translate

Sunday, May 25, 2025

๐Ÿก U.S. Housing Market Trends – May 2025

As of May 25, 2025, the U.S. housing market continues to exhibit mixed signals, driven by evolving buyer behavior, shifting inventory levels, and dynamic pricing. Recent data reveals notable contrasts between short-term momentum and long-term uncertainty, offering both opportunities and caution for buyers, sellers, investors, and policymakers.


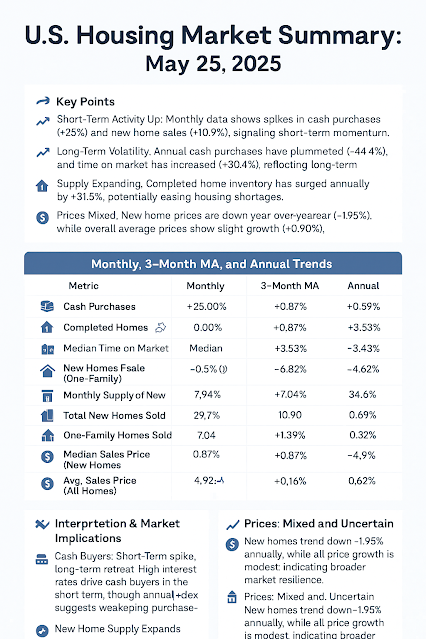
๐Ÿ”‘ Key Trends at a Glance

  • ๐Ÿ“ˆ Short-Term Momentum:
    Cash purchases surged +25% month-over-month, and new one-family home sales increased +10.9%, reflecting temporary demand spikes.

  • ๐Ÿ—️ Supply Expansion:
    Completed new homes for sale are up +31.5% year-over-year, suggesting progress in addressing housing shortages.

  • ๐Ÿ•’ Longer Time on Market:
    Newly completed homes are taking +30.4% longer to sell than they did a year ago — signaling cooling demand or buyer hesitation.

  • ๐Ÿ’ต Prices Mixed:
    New home median prices fell -1.95% annually, while overall average prices rose a modest +0.90%, highlighting diverging trends.


๐Ÿ“Š Detailed Market Breakdown

MetricMonthly3-Month AvgAnnual
Cash Purchases+25.00%-11.11%-44.44%
Completed Homes for Sale0.00%+0.87%+31.46%
Time on Market for New Homes0.00%+3.53%+30.43%
Total New Homes for Sale-0.59%+0.53%+8.62%
Monthly Supply of New Homes-10.99%-3.30%+5.19%
Total New Homes Sold+7.94%+6.82%+4.62%
New One-Family Homes Sold+10.90%+4.08%+3.34%
Median Sales Price (New Homes)+0.87%-1.80%-1.95%
Average Sales Price (All Homes)-1.39%+0.11%+0.90%
Median Sales Price (All Homes)-0.57%+0.19%+0.82%

๐Ÿง  Insights and Implications

๐Ÿ”น For Buyers

  • With new home inventory expanding and prices softening, now may be a favorable time to negotiate.

  • Longer time on market gives buyers added leverage — especially for newly completed homes.

๐Ÿ”น For Sellers

  • Adjusting pricing expectations and marketing strategies is key as homes sit on the market longer.

  • Sellers should be aware of the decline in cash buyers year-over-year, even if short-term spikes occur.

๐Ÿ”น For Investors

  • Inventory growth and steady sales offer potential, but price fluctuations and slower turnover require caution.

  • High interest rates may continue to pressure certain segments of the market.

๐Ÿ”น For Policymakers

  • The volatility in cash buyer behavior and persistent affordability concerns call for balanced housing and lending policies.

  • Continued support for new construction could help ease long-term supply issues.


๐Ÿ”— Sources


๐Ÿ“ข Final Thought:
The U.S. housing market is entering a transitional phase. Stakeholders must navigate a landscape marked by surging short-term activity, longer sales cycles, and nuanced pricing signals. Data-driven decision-making will be essential in the months ahead.

๐Ÿ” Share your thoughts or insights in the comments below.
๐Ÿ“Š #HousingMarket #RealEstateTrends #EconomicAnalysis #EconReviews


Friday, May 16, 2025

๐Ÿญ Industrial Production Update: Signs of Strength, But Manufacturing Weakens


As we examine the latest trends in industrial activity, a layered picture of the U.S. economy emerges—one of annual growth and expansion, but also early signs of weakness, particularly within manufacturing.


๐Ÿ”ง Key Findings from the Data

1️⃣ Industrial Production: Still Growing, But Recent Softness

  • Monthly Decline: Overall production dipped slightly by -0.01%, but manufacturing saw steeper falls: -0.40% (NAICS) and -0.43% (SIC).

  • Quarterly Resilience: The 3-month average remains positive across the board, suggesting the decline may be temporary.

  • Annual Strength: Year-over-year production grew +1.49% overall, and manufacturing output also increased, albeit more modestly.

2️⃣ Capacity Utilization: A Red Flag for Manufacturing

  • Monthly Drops: Utilization in manufacturing fell -0.50%, signaling reduced factory usage and potential demand weakness.

  • Flat Short-Term Trend: Quarterly change is nearly flat for the total sector and modestly positive for manufacturing.

  • Annual Warning: Manufacturing capacity utilization declined -0.09% year-over-year, a potential indicator of slack in the system.


⚠️ Why This Matters

The broader industrial sector remains healthy, but manufacturing—often an early signal of broader economic shifts—is showing signs of cooling. A sustained drop in utilization can lead to:

  • Lower capital investment

  • Slower job creation

  • Broader economic stagnation if demand fails to rebound


๐Ÿงญ What to Watch

Keep an eye on:

  • Inventory levels: Are firms cutting back due to oversupply?

  • New orders: Are manufacturers seeing weaker demand?

  • Employment trends: Do layoffs begin to rise in affected sectors?


Bottom Line:
We're still in a phase of positive industrial momentum, but cracks are appearing. If demand doesn’t rebound soon, particularly in manufacturing, we could be looking at a shift from resilience to retrenchment.


Tuesday, May 13, 2025

April 2025 CPI Report: Inflation Continues to Ease


The latest Consumer Price Index (CPI) data from the Bureau of Labor Statistics shows encouraging signs that inflationary pressures are continuing to cool.

Key Highlights:

  • CPI-U: +0.2% MoM | +2.3% YoY – the lowest YoY rise since Feb 2021
  • Core CPI (less food & energy): +0.2% MoM | +2.8% YoY
  • Energy prices fell 3.7% YoY, driven by double-digit declines in gasoline and fuel oil
  • Food at home saw the largest MoM decline since Sept 2020 (-0.4%)
  • Shelter costs remain sticky, up 4.0% YoY, continuing to be the main driver of core inflation

What’s notable is the divergence between falling goods prices (especially energy and used vehicles) and still-rising services and rent. This mixed trend presents both opportunities and challenges for policymakers and markets.

As we track inflation’s path, April’s data supports the disinflation narrative, but the sticky core components remind us that the Fed’s job isn't done yet.

See the full summary in the infographic below.

#Inflation #CPI #Economy #InterestRates #FederalReserve #April2025 #BLS #EconomicUpdate #MacroTrends #ConsumerPrices

Tariffs, Inflation, and Monetary Policy: Rethinking the Central Bank's Response

Tariffs, Inflation, and Monetary Policy: Rethinking the Central Bank's Response

What happens when a government imposes tariffs on imported goods—not just politically, but economically?

A recent NBER paper by Ivรกn Werning, Guido Lorenzoni, and Veronica Guerrieri reveals a powerful insight: tariffs act as cost-push shocks, akin to labor wedge distortions in closed economies. This reframes how we think about the role of central banks in times of rising protectionism.

Key takeaways:

  • Tariffs shift the Phillips curve upward, creating a conflict between price stability and output stabilization.
  • Optimal monetary policy should tolerate short-run inflation, smoothing the adjustment to a more distorted long-run equilibrium.
  • In the presence of nominal wage rigidities, the cost of disinflation increases—meaning the traditional “see-through” approach to supply shocks may not be ideal.
  • Commitment matters: Even under a timeless perspective, the best path involves a temporary inflation overshoot.

This challenges the conventional wisdom and offers an analytical foundation for central banks grappling with the consequences of trade wars and protectionist policies.

Thoughts? Do you think central banks should accommodate tariff-induced inflation shocks or double down on price stability?

#MonetaryPolicy #Tariffs #Inflation #Macroeconomics #NBER #CentralBanking #EconomicPolicy #CostPushShocks

Saturday, May 10, 2025

April 2025 U.S. Automotive Industry: Riding Strong Exports Against Domestic Headwinds


Introduction

April’s data paints a tale of two realities: robust international demand and domestic execution challenges. While exports and light‐truck sales soared year-over-year, domestic production and inventories slipped—suggesting short-term volatility driven by trade policy and supply adjustments.


1. Export Powerhouse

  • Auto Exports jumped 55.5% annually despite a 3.1% monthly pullback.

  • Global appetite—especially from NAFTA partners—remains intense, helping OEMs offset some U.S. market softness.

2. Production & Inventory Strains

  • Domestic Production fell 14.7% year-over-year, though it did tick up 9.7% from March.

  • Inventories are down nearly 20% annually; the inventory/sales ratio plunged 21.1%—indicating tight supply and potential dealer shortages.

3. Consumer Preferences

  • Light-Weight Trucks continue to dominate, with 11.1% annual growth, even as they dipped 1.9% month-to-month.

  • Passenger cars lag—domestic auto sales fell over 13% year-over-year.


What’s Driving These Trends?

  • Tariffs on April 3rd prompted a rush to buy pre-rate hikes, lifting annual comparisons despite monthly dips.

  • Supply Chain Shifts: OEMs are supplementing U.S. plants with imports from Mexico (+41.9% YoY) and Canada (+33.1% YoY).

  • Consumer Demand for SUVs and light trucks remains the sector’s engine, while CCC pricing pressures squeeze entry-level car segments.


Implications for Stakeholders

  • Consumers: Consider buying sooner—tariffs may drive sticker‐shock if they linger.

  • Manufacturers: Face a balancing act: ramp domestic output without bloating inventories, while capitalizing on export strength.

  • Investors: Watch tariff policy and inventory metrics as leading indicators of margin pressures and sales sustainability.

  • Policymakers: Declining domestic production and rising imports underscore the need for incentives or relief to bolster U.S. manufacturing employment.


Conclusion

April’s snapshot underscores the U.S. auto industry’s resilience abroad and vulnerabilities at home. As trade policy evolves and consumer tastes shift, close monitoring of production, inventory, and tariff developments will be critical for navigating the road ahead. 

Sunday, May 4, 2025

๐Ÿ›️ What the FY2026 U.S. Discretionary Budget Means for the Economy: A Breakdown


The Trump administration’s FY2026 discretionary budget proposal makes bold moves—deep cuts in domestic programs, a surge in defense and border security spending, and a vision of a smaller federal footprint. But what does all of this mean for the broader U.S. economy? Let’s break it down.

๐Ÿ“‰ Slower Growth Ahead?

The budget slashes non-defense discretionary spending by 22.6%, bringing it to its lowest inflation-adjusted level in over two decades. This includes steep reductions in education, scientific research, environmental programs, and public health. While defense and homeland security spending will increase—pushing total defense funding beyond $1 trillion for the first time—the overall cut in spending is expected to shave 0.5% or more off U.S. GDP in FY2026. That means slower growth—possibly a mild economic contraction—especially if the private sector doesn’t pick up the slack.

๐Ÿ‘ท Labor Market: Federal Layoffs, Private-Sector Shifts

Tens of thousands of federal jobs are on the line, with some agencies facing staffing cuts of up to 35%. That includes departments like Education, EPA, and IRS. Simultaneously, job openings in defense, construction, and border security will grow. Think engineers, contractors, and law enforcement personnel—but also expect regional disparities as D.C. and university towns lose federal jobs while border states see hiring booms.

๐Ÿ“‰ Inflation Cooling, Interest Rates Holding?

The spending cuts are deflationary—less government money means less demand pressure on prices. Combined with potential tax cut extensions, the net fiscal stance will decide how inflation moves. The Fed may ease rates in response to slower growth and declining inflation. But long-term interest rates will depend on whether deficits truly fall. Investors remain cautious as debt continues rising, potentially keeping yields elevated.

๐Ÿ’ฐ Deficit Reduction? Maybe.

While the budget aims to save “trillions” over a decade, it doesn’t address entitlements or revenue—the real drivers of debt. Extending 2017 tax cuts (as hinted) would wipe out much of the savings. Without broader fiscal reform, the debt-to-GDP ratio may keep rising past 107% by 2029. The budget slows the climb, but doesn’t stop it.

๐Ÿ—️ Sector Winners & Losers

๐ŸŸข Winners:

  • Defense Industry: Big boosts in weapons procurement, shipbuilding, and military R&D.

  • Border & Infrastructure Contractors: Ports, rail safety, and border wall projects get new funds.

  • Fossil Fuel Sector: Green energy grants cut; fossil energy research and mining promoted.

๐Ÿ”ด Losers:

  • Education & Science: NSF, NIH, and Department of Education face massive cuts—over 30% in some cases.

  • Public Health: CDC funding nearly halved. Biotech and health sectors lose research dollars.

  • Environment & Climate: EPA, water projects, and clean energy programs rolled back or eliminated.

  • Foreign Aid: USAID absorbed, global development and humanitarian programs slashed.

๐Ÿ“‰ Investor Takeaway

Markets may cheer the defense buildup—but the broad economic effect is contractionary. Expect a shift from social investment to hard infrastructure and security, a cooler inflation environment, and rising uncertainty about long-term fiscal health.


๐Ÿ’ฌ Bottom Line: The FY2026 budget aims to remake the federal government—and its economic fingerprints will be felt across GDP, labor markets, and industry sectors. Whether it restores fiscal order or undercuts future growth depends on what comes next.

Saturday, May 3, 2025

๐Ÿ“Š FY2026 Discretionary Budget Request: A Sharp Turn Toward Defense, Security, and Deregulation

 The Trump administration’s FY2026 discretionary budget request marks a dramatic departure from recent federal spending trends, with a clear prioritization of national defense, border security, and reduced federal involvement in social and climate-focused programs. This proposed budget reflects a deeply ideological reshaping of the federal government’s role, aiming to strengthen “America First” objectives.

Department/Agency2025 Enacted2026 RequestChange ($)Change (%)
Department of Defense (w/ reconciliation)848.3961.6+113.3+13.4%
Homeland Security (w/ reconciliation)65.1107.4+42.3+64.9%
Health and Human Services (HHS)127.093.8-33.3-26.2%
Housing and Urban Development (HUD)77.043.5-33.6-43.6%
Education78.766.7-12.0-15.3%
Energy (DOE)49.845.1-4.7-9.4%
   ↳ NNSA only24.024.00.00.0%
   ↳ DOE excluding NNSA25.821.1-4.7-18.2%
NNSA (incl. reconciliation)24.030.0+6.0+25.0%
Agriculture27.322.3-5.0-18.3%
Interior16.811.7-5.1-30.5%
Justice36.033.2-2.7-7.6%
Labor13.38.6-4.6-34.9%
State and International Programs58.79.6-49.1-83.7%
   ↳ Excl. rescissions59.631.2-28.4-47.7%
Transportation25.226.7+1.5+5.8%
Treasury14.211.5-2.7-19.0%
Commerce (excl. rescission)10.28.5-1.7-16.5%
Commerce Rescission (NEF)-9.60.0+9.6-100.0%

๐Ÿ”บ Massive Shifts in Priorities

The total discretionary budget request for FY2026 proposes:

  • $1.01 trillion for defense, a 13.4% increase from FY2025.

  • $107.4 billion for Homeland Security, up 64.9%, marking the highest-ever request for the department.

  • Deep cuts to domestic programs, including health, education, housing, and foreign aid.

These changes are not just budgetary—they’re philosophical. The administration argues that many programs currently managed by the federal government are better left to states or the private sector.


๐Ÿ“‰ Who Takes the Cuts?

Significant reductions are proposed across numerous agencies:

DepartmentFY2026 Request% Change vs FY2025
Health & Human Services$93.8B-26.2%
Housing & Urban Development$43.5B-43.6%
Education$66.7B-15.3%
State/International Programs$9.6B-83.7%
Energy (Non-NNSA)$21.1B-18.2%

Most of these cuts involve programs related to public health (NIH, CDC), equity in education (GEAR UP, TRIO), affordable housing, environmental protection (EPA), and foreign assistance (USAID, UN).


๐Ÿงฑ Where the Money Is Going

At the top of the funding list are the Department of Defense and Department of Homeland Security, which together represent nearly half of the entire discretionary budget. Key initiatives include:

  • $27B for the “Golden Dome” missile defense system

  • $43.8B for enhanced border security including wall construction, removal operations, and surveillance tech

  • Increased investment in veterans’ health, charter schools, and drinking water infrastructure

The National Nuclear Security Administration (NNSA) also receives a substantial 25% funding boost.