Translate

Tuesday, May 28, 2024

S&P CoreLogic Case-Shiller Home Price Indices: Latest Trends and Insights


The latest S&P CoreLogic Case-Shiller Home Price Indices, released today, provide a comprehensive view of the U.S. housing market, highlighting significant trends and regional variations. These indices are crucial for understanding the dynamic landscape of home prices across the nation.

West Coast Housing Market Rebounds

One of the most notable trends is the strong rebound in housing prices on the West Coast. Cities like San Diego, San Francisco, and Seattle have seen substantial increases in both monthly and annual home prices. This rebound is largely driven by IT companies' efforts to bring employees back to the office, leading to higher demand for housing near major tech hubs.

  • San Diego, CA: Monthly home prices increased by 2.2%, with an annual rise of 11.1%.
  • San Francisco, CA: Monthly prices grew by 2.6%, while annual prices rose by 4.9%.
  • Seattle, WA: Monthly prices surged by 2.7%, with an annual increase of 7.8%.

The robust growth in these cities indicates a strong market recovery, driven by urban revitalization and increased investment in local infrastructure. The demand for housing near workplaces has intensified, pushing up prices significantly.

Southern Housing Market Slows Down

In contrast, the Southern housing market, which experienced rapid price increases during the pandemic due to remote work flexibility, is now seeing a slowdown. Cities like Miami, Tampa, Dallas, and Phoenix are showing more moderate price growth as the demand shifts back to urban tech centers.

  • Miami, FL: Monthly home prices rose by 1.0%, with an annual increase of 8.2%.
  • Tampa, FL: Monthly prices increased by 0.5%, while annual prices grew by 3.8%.
  • Dallas, TX: Monthly prices went up by 1.2%, with an annual rise of 3.6%.
  • Phoenix, AZ: Monthly prices grew by 0.5%, with an annual increase of 4.9%.

These figures reflect a market adjustment as the pandemic-driven surge in demand for Southern housing stabilizes. The slower growth rates indicate a return to more typical market conditions, influenced by the reduced prevalence of remote work.

National and Composite Indices

On a broader scale, the U.S. National Home Price Index showed a monthly increase of 1.3% and an annual rise of 6.5%. The 10-City Composite Index recorded a monthly growth of 1.6% and an annual increase of 8.2%, while the 20-City Composite Index saw a monthly rise of 1.6% and an annual growth of 7.4%.

Key Takeaways

  1. Regional Divergence: The West Coast is experiencing a robust rebound in housing prices, driven by the return to office policies of IT companies. In contrast, the Southern housing market is slowing down after the pandemic-induced boom.
  2. Urban Revitalization: Cities with high concentrations of tech companies are seeing significant price increases, indicating strong market recovery and increased demand for housing near workplaces.
  3. Market Stabilization: The Southern market is returning to more typical growth patterns, reflecting the shifting dynamics of remote work and regional demand.

The latest S&P CoreLogic Case-Shiller Home Price Indices underscore the importance of regional factors in shaping the U.S. housing market. As we move forward, these trends will continue to evolve, influenced by economic conditions, employment patterns, and local market dynamics. For homeowners, potential buyers, and investors, understanding these indices is crucial for making informed decisions in an ever-changing market.

Sunday, May 26, 2024

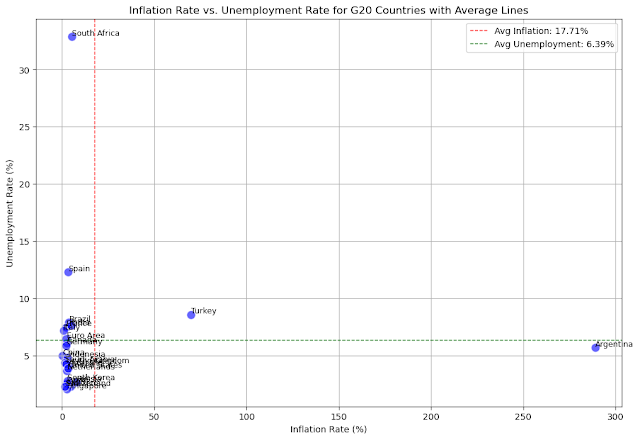
Inflation Rate vs. Unemployment Rate for G20 countries


 The scatter plot above illustrates the relationship between inflation rates and unemployment rates for the G20 countries. Here are some key observations:

  1. High Inflation and Moderate Unemployment:

    • Argentina: Extremely high inflation (289%) with moderate unemployment (5.7%).
    • Turkey: Very high inflation (69.8%) with high unemployment (8.6%).
  2. Moderate Inflation and Moderate to High Unemployment:

    • South Africa: Moderate inflation (5.2%) but very high unemployment (32.9%).
    • Brazil: Moderate inflation (3.69%) with high unemployment (7.9%).
    • India: Moderate inflation (4.83%) with high unemployment (7.64%).
  3. Low to Moderate Inflation and Low to Moderate Unemployment:

    • Australia: Moderate inflation (3.6%) with low unemployment (4.1%).
    • Canada: Moderate inflation (2.7%) with low unemployment (6.1%).
    • United States: Moderate inflation (3.4%) with low unemployment (3.9%).
    • Germany: Low inflation (2.2%) with low unemployment (5.9%).
  4. Low Inflation and Low Unemployment:

    • Japan: Low inflation (2.5%) with low unemployment (2.6%).
    • Switzerland: Low inflation (1.4%) with low unemployment (2.3%).
  5. Outliers:

    • South Africa: Stands out with very high unemployment compared to other countries.
    • Argentina: Notable for its extremely high inflation rate.

This plot helps visualize how different G20 countries are managing their inflation and unemployment, providing insights into their economic stability and challenge

Friday, May 24, 2024

Recent Trends in the U.S. Housing Market

The U.S. housing market has experienced significant fluctuations recently, influenced by various economic factors. This blog post delves into the latest trends, examining both monthly and annual percentage changes in key housing metrics.

Median and Average Sales Prices

The Median Sales Price of Houses Sold saw a slight monthly decline of -0.6%, yet it exhibited a robust annual increase of 18.5%. On the other hand, the Average Sales Price of Houses Sold showed a significant monthly rise of 3.0%, with an even more substantial annual growth of 22.9%. These figures indicate a strong upward trend in house prices over the past year, despite some monthly volatility.

Financing and Sales Dynamics

Houses Sold by Type of Financing, Cash Purchase dropped by -7.7% on a monthly basis but surged by 20.0% annually. This suggests a year-over-year increase in cash purchases, possibly reflecting changing buyer preferences or market conditions.

New Houses Sold by Sales Price experienced a significant monthly rise of 17.5%, with an annual growth of 8.1%. Meanwhile, New Houses for Sale by Stage of Construction, Completed increased by 7.7% monthly and by a striking 42.0% annually. These changes indicate a dynamic market for new houses, with a notable increase in completed homes ready for sale.

Supply and Market Dynamics

The Monthly Supply of New Houses rose by 7.1% monthly and 21.3% annually, indicating a growing inventory of available homes. Conversely, the Median Number of Months on Sales Market for Newly Completed Homes dropped by -14.8% monthly and -8.0% annually, suggesting faster sales of new homes.

New One Family Houses

The market for New One Family Houses showed mixed trends. New One Family Houses for Sale increased by 3.5% monthly and 13.1% annually, while New One Family Houses Sold saw declines of -4.7% monthly and -7.7% annually. The Median Sales Price for New Houses Sold decreased slightly by -1.4% monthly but grew by 3.9% annually.

Overall, these trends highlight a complex and evolving U.S. housing market, characterized by rising prices, fluctuating sales, and increasing inventories.

Visualizing the Trends

The following bar plot provides a visual summary of the latest monthly and annual percentage changes for key housing metrics:


This plot highlights the monthly and annual percentage changes across various housing market metrics, providing a clear and concise visual representation of recent trends.

In summary, the U.S. housing market is marked by a mix of rising prices, fluctuating sales, and increasing inventories. Understanding these trends is crucial for making informed decisions in the housing market.

Thursday, May 23, 2024

Title: Existing Homes Market: Declining Sales, Rising Inventories, and Increasing Prices


The existing homes market has been experiencing significant changes in recent months, as evidenced by the latest data. In this blog post, we'll delve into the key metrics and discuss what they mean for buyers and sellers.

Existing home sales have declined by 1.9% compared to both the previous month and the same period last year. This decrease in sales suggests that demand for existing homes may be slowing down, possibly due to factors such as rising prices, economic uncertainty, or changes in consumer preferences.

Despite the decline in sales, housing inventory for existing homes has increased substantially, with a 9.0% monthly increase and a 16.3% annual increase. This growth in inventory indicates that more homeowners are putting their properties on the market, perhaps in response to the rising prices or changing market conditions.

Surprisingly, the median sales price of existing homes has continued to rise, despite the decline in sales and increase in inventory. The data shows a 3.7% monthly increase and a 5.7% annual increase in median sales prices. This suggests that while demand may be slowing, prices have not yet been significantly impacted, possibly due to factors such as  still-competitive market in certain areas.

One of the most important metrics for buyers is the Months Supply, which represents the number of months it would take to sell the current inventory at the current sales rate. The data reveals that Months Supply has increased by 9.4% compared to the previous month and by 16.7% compared to the same period last year. This increase suggests that buyers may have more options and potentially better negotiating power, as there is a larger supply of homes available relative to the current sales pace.

In conclusion, the existing homes market is undergoing significant changes, with declining sales, rising inventories, and increasing prices. While the market may be becoming more favorable for buyers in terms of available options, the continued price increases may still present challenges for affordability. As always, it's essential for both buyers and sellers to stay informed about market conditions and work with experienced real estate professionals to navigate these changes successfully.