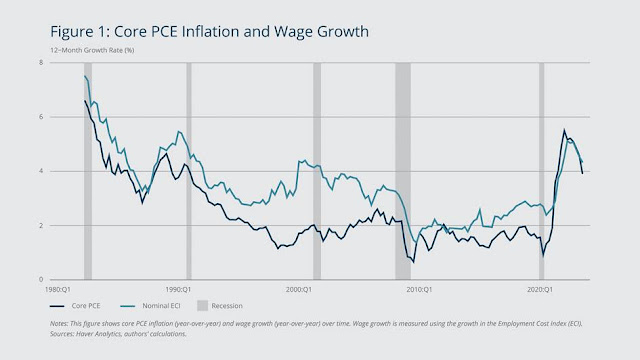
PCE and nominal wage growth rates tend to move simultaneously. As wages grow, consumers have more money to spend, which can lead to an increase in PCE (Personal Consumption Expenditures). The data shows that wage growth rates were around 4% before the internet bubble collapsed in the early 2000s. Prior to the financial crisis, wage growth rates stayed around 3%.
The blue line represents the Core PCE Inflation rate, which measures inflation excluding food and energy prices. The line exhibits significant fluctuations over the years, peaking around the early 1990s and late 2000s, while reaching lower levels in the mid-2000s and late 2010s.
The orange line depicts Nominal Wage Growth, which appears to follow a smoother trend compared to the inflation rate. Wage growth generally remained below the inflation rate during periods of high inflation but exceeded inflation during periods of lower inflation.
The gray bars indicate periods of recession in the US economy. Notably, both inflation and wage growth tend to decline during recessionary periods.
The plot effectively illustrates the historical relationship between inflation and wage growth, highlighting the periods when they diverged or converged, and how they were impacted by economic cycles.

No comments:
Post a Comment