My objective is to simplify and clarify economics, making it accessible to everyone. It is important to remember that the opinions expressed in my writing are solely my own and should not be considered as financial advice. Any potential losses incurred from acting upon the information provided in my writing are the responsibility of the individual, and I cannot be held liable for them.
Translate
Sunday, April 23, 2023
New Home Housing Market
The following charts display the trends of new one-family homes sold, new privately owned housing units started, homeownership, and the U.S. National Home Price Index. In recent years, there has been a decline in the number of new homes sold and new housing units started. The U.S. National Home Price Index has also started to decline. Despite these trends, homeownership rates have continued to increase, although the rates of increase have slowed down.
Python codes - import pandas_datareader.data as web
import pandas as pd
import numpy as np
import matplotlib.pyplot as plt
start = '1990-01-01'
Housing = web.DataReader(['HSN1F'], 'fred', start=start)
Diff_Housing = Housing.pct_change(periods=12) * 100
fig, axs = plt.subplots(2, 1)
axs[0].bar(Housing.index[-252*20:], Housing['HSN1F'][-252*20:],
color='blue', width=20)
axs[0].set_title('New One Family Sold')
axs[0].set_ylabel('Thousands')
axs[1].bar(Diff_Housing.index[-252*10:], Diff_Housing['HSN1F'][-252*10:],
color='blue', width=10)
axs[1].set_title('New One Family Houses Sold (HSN1F) Changes from same period in previous year')
axs[1].set_ylabel('Percent')
axs[1].set_xlabel('Year')
plt.show()
HOUST = web.DataReader(['HOUST'], 'fred', start=start)
Diff_HOUST = HOUST.pct_change(periods=12) * 100
fig, axs = plt.subplots(2, 1)
axs[0].bar(HOUST.index[-252*20:], HOUST['HOUST'][-252*20:],
color='blue', width=20)
axs[0].set_title('Housing Starts: Total: New Privately Owned Housing Units Started (HOUST)')
axs[0].set_ylabel('Thousands')
axs[1].bar(Diff_HOUST.index[-252*20:], Diff_HOUST['HOUST'][-252*20:],
color='blue', width=20)
axs[1].set_title('Housing Starts: Total: New Privately Owned Housing Units Started (HOUST)')
axs[1].set_ylabel('Percent')
axs[1].set_xlabel('Year')
plt.show()
RSAHORUSQ156S = web.DataReader(['RSAHORUSQ156S'], 'fred', start=start)
Diff_RSAHORUSQ156S = RSAHORUSQ156S.pct_change(periods=12) * 100
fig, axs = plt.subplots(2, 1)
axs[0].plot(RSAHORUSQ156S.index[-252*20:], RSAHORUSQ156S['RSAHORUSQ156S'][-252*20:])
axs[0].set_title('Homeownership Rate for the United States (RSAHORUSQ156S)')
axs[0].set_ylabel('Percent')
axs[1].bar(Diff_RSAHORUSQ156S.index[-252*20:], Diff_RSAHORUSQ156S['RSAHORUSQ156S'][-252*20:],
color='blue', width=20)
axs[1].set_title('Homeownership Rate for the United States (RSAHORUSQ156S)')
axs[1].set_ylabel('Percent')
axs[1].set_xlabel('Year')
plt.show()
CSUSHPINSA = web.DataReader(['CSUSHPINSA'], 'fred', start=start)
Diff_CSUSHPINSA = CSUSHPINSA.pct_change(periods=12) * 100
fig, axs = plt.subplots(2, 1)
# plot the time series data
axs[0].plot(CSUSHPINSA.index[-252*20:], CSUSHPINSA['CSUSHPINSA'][-252*20:])
axs[0].set_title('U.S. National Home Price Index (CSUSHPINSA)')
axs[0].set_ylabel('Index Value')
# plot the annual percentage change
axs[1].bar(Diff_CSUSHPINSA.index[-252*20:], Diff_CSUSHPINSA['CSUSHPINSA'][-252*20:],
color='blue', width=20)
axs[1].set_title('Annual Percent Change in U.S. National Home Price Index (CSUSHPINSA)')
axs[1].set_ylabel('Percent')
axs[1].set_xlabel('Year')
# show the plot
plt.show()
Saturday, April 22, 2023
China GDP (1960-2020 )
China's nominal GDP has experienced an average growth rate of approximately 10%
since 1960. Remarkably, the country has not experienced a recession since 1990.
However, given the recent slowdown in China's GDP growth rates since the
mid-2010s, it remains to be seen whether China can continue to sustain its
growth without experiencing a recession.
Friday, April 21, 2023
Assets and Liabilities of Commercial Banks in the United States - H.8 as of March 2023
The Federal Reserve's statistical release "H.8 - Assets and Liabilities of Commercial Banks in the United States", which provides data on the assets and liabilities of commercial banks in the US. The release provides data on a weekly basis, and includes information such as total assets and liabilities, loans and leases, and deposits. The data is broken down into various categories, such as type of loan, size of deposit, and type of security. The release is important for understanding trends in the banking industry and can be used by policymakers and researchers to monitor the health of the financial system.
The report on the Assets and Liabilities of Commercial Banks in the United States for March 2023 shows a positive trend with a 6.5% increase in total assets and a 3.1% increase in total liabilities. Among the assets, loans to commercial banks saw a significant surge of 345.5%. However, treasury and agency securities experienced a dip of 24.1% in March. On the liabilities side, borrowing showed a substantial rise of 249.8%, whereas other deposits witnessed a decrease of 28.3%. These figures highlight the dynamic nature of the banking sector and provide valuable insights into the trends that are shaping it.
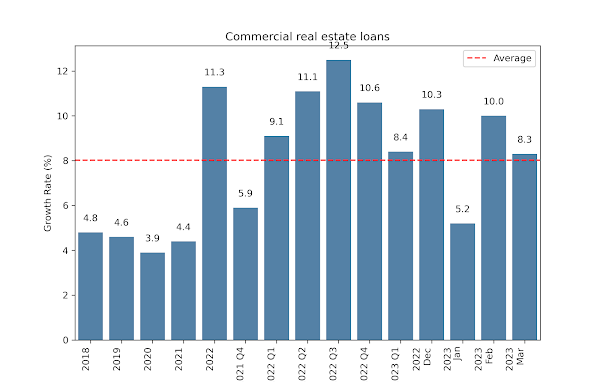
According to the latest report on the Assets and Liabilities of Commercial Banks in the United States - H.8, as of March 2023, real estate loans, including residential and commercial ones, experienced an increase, although the overall trend has been declining since the second quarter of 2022."
Percent change at break adjusted, seasonally adjusted, annual rate.
Source: https://www.federalreserve.gov/releases/h8/current/default.htm
Subscribe to:
Comments (Atom)


