Translate

Wednesday, September 13, 2017

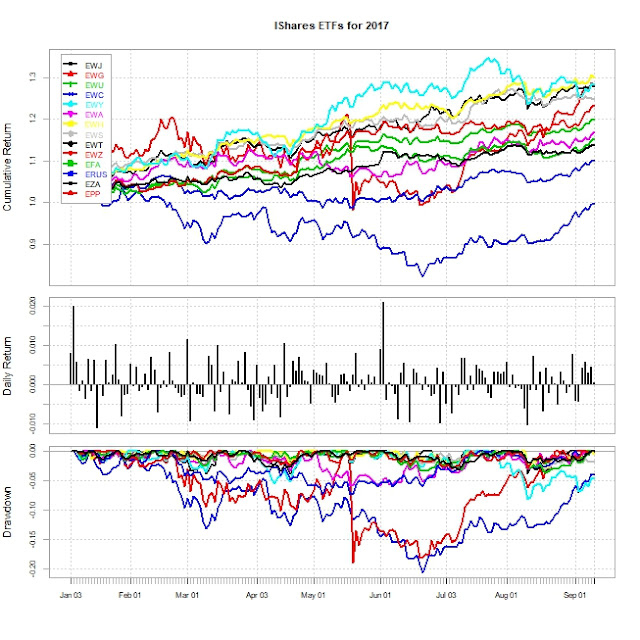
IShares ETFs from 1-1-2017 to 9-12-2017


The following chart shows the 2017 performance charts of 
              "EWJ", #iShares Japan
             "EWG", #iShares Germany
             "EWU", #iShares UK
             "EWC", #iShares Canada
             "EWY", #iShares South Korea
             "EWA", #iShares Australia
             "EWH", #iShares Hong Kong
             "EWS", #iShares Singapore
          
             "EWT", #iShares Taiwan
             "EWZ", #iShares Brazil
             "EFA", #iShares EAFE
             "ERUS", #iShares Russia
             "EZA", #iShares South Africa
             "EPP" #iShares Pacific Ex Japan
Performances of ETFs  as of 9-12-207 (from 1-1-2017)
Rank ETFs Annualized Returns Annualized STD Annualized Sharpe Ratio
1 EWH 46.0% 9.8% 4.6017
2 EWS 37.6% 10.1% 3.6736
3 EFA 30.2% 8.3% 3.5502
4 EWT 42.6% 11.9% 3.5114
5 EPP 32.5% 10.5% 3.0343
6 EWG 35.1% 11.8% 2.9228
7 EWY 43.2% 15.7% 2.7018
8 EWU 22.8% 8.9% 2.4874
9 EWJ 20.5% 8.0% 2.4797
10 EWA 25.2% 13.0% 1.8952
11 EWZ 42.8% 32.1% 1.3088
12 EZA 28.6% 22.1% 1.2609
13 EWC 14.5% 11.5% 1.2091
14 ERUS -0.7% 19.5% -0.0595


The following chart shows how annualized returns and risks have been moving during 2017.

No comments:

Post a Comment