Translate

Wednesday, September 13, 2017

IShares ETFs from 1-1-2017 to 9-12-2017


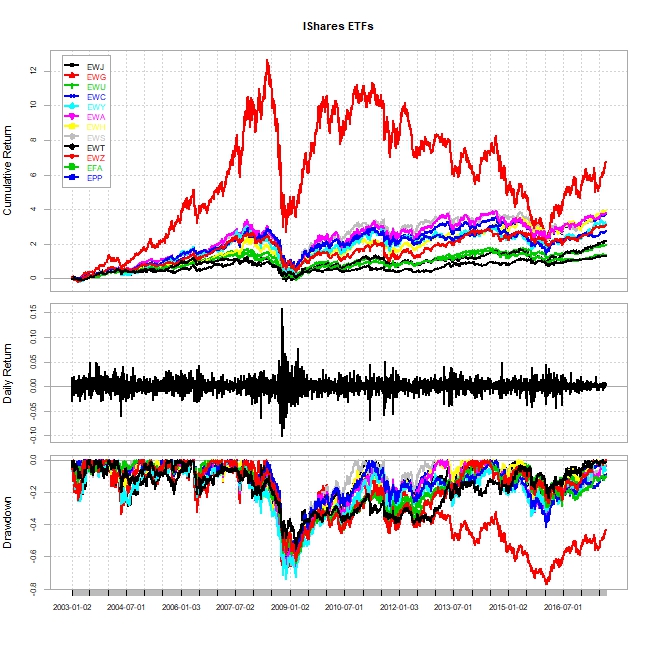
The following chart shows the 2017 performance charts of 
              "EWJ", #iShares Japan
             "EWG", #iShares Germany
             "EWU", #iShares UK
             "EWC", #iShares Canada
             "EWY", #iShares South Korea
             "EWA", #iShares Australia
             "EWH", #iShares Hong Kong
             "EWS", #iShares Singapore
          
             "EWT", #iShares Taiwan
             "EWZ", #iShares Brazil
             "EFA", #iShares EAFE
             "ERUS", #iShares Russia
             "EZA", #iShares South Africa
             "EPP" #iShares Pacific Ex Japan
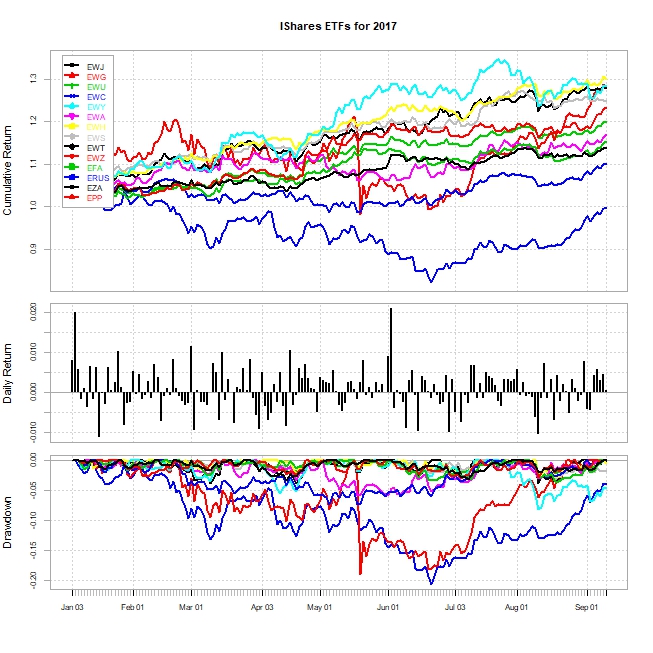
Performances of ETFs  as of 9-12-207 (from 1-1-2017)
Rank ETFs Annualized Returns Annualized STD Annualized Sharpe Ratio
1 EWH 46.0% 9.8% 4.6017
2 EWS 37.6% 10.1% 3.6736
3 EFA 30.2% 8.3% 3.5502
4 EWT 42.6% 11.9% 3.5114
5 EPP 32.5% 10.5% 3.0343
6 EWG 35.1% 11.8% 2.9228
7 EWY 43.2% 15.7% 2.7018
8 EWU 22.8% 8.9% 2.4874
9 EWJ 20.5% 8.0% 2.4797
10 EWA 25.2% 13.0% 1.8952
11 EWZ 42.8% 32.1% 1.3088
12 EZA 28.6% 22.1% 1.2609
13 EWC 14.5% 11.5% 1.2091
14 ERUS -0.7% 19.5% -0.0595


The following chart shows how annualized returns and risks have been moving during 2017.


Sunday, September 10, 2017

Analyzing iShares ETFs from January 2003

iShares ETFs

 
             "EWJ", #iShares Japan
             "EWG", #iShares Germany
             "EWU", #iShares UK
             "EWC", #iShares Canada
             "EWY", #iShares South Korea
             "EWA", #iShares Australia
             "EWH", #iShares Hong Kong
             "EWS", #iShares Singapore
             "EWT", #iShares Taiwan
             "EWZ", #iShares Brazil
             "EFA", #iShares EAFE
             "EPP" #iShares Pacific Ex Japan
           
  EWJEWGEWUEWCEWYEWAEWHEWSEWTEWZEFAEPP
AnnualizedReturn5.9%10.1%6.1%9.4%10.2%11.3%11.5%11.2%8.2%15.0%7.6%11.1%
AnnualizedStd21.9%26.2%23.5%22.6%32.4%27.9%25.4%25.4%27.7%37.8%22.2%25.3%
AnnualizedSharpe0.24310.36460.23750.39330.29760.3830.4310.41970.27560.38070.31970.4177


Saturday, September 9, 2017

Currencies from January 1995 to September 2017


The following chart shows the performances of currencies from January 1995 to September 2017


The Korean Won has been depreciating at 1.6% annually against dollar.

    Korea Malaysia Singapore    Taiwan China Japan Thailand    Brazil Mexico India USDOther USDBroad
Annualized Return 1.60% 2.30% -0.30% 0.60% -1.10% 0.40% 1.20% 6.00% 5.30% 3.20% 2.40% 1.00%
Annualized Std 14.10% 8.50% 5.90% 5.40% 1.70% 11.10% 10.40% 16.00% 13.20% 7.00% 4.30% 4.80%


The following chart shows the diagram of correlation matrix among currencies.


Thursday, September 7, 2017

SPDR Sector ETFs Analysis

There are eight SPDR sector ETFs :        

             "XLB", #SPDR Materials sector
             "XLE", #SPDR Energy sector
             "XLF", #SPDR Financial sector
             "XLP", #SPDR Consumer staples sector
             "XLI", #SPDR Industrial sector
             "XLU", #SPDR Utilities sector
             "XLV", #SPDR Healthcare sector
             "XLK", #SPDR Tech sector
             "XLY", #SPDR Consumer discretionary sector

the following chart shows the performances of SPDR sector ETFs from January 2003 and: XLU (Utilities sector) and XLK (Tech sector) have the highest cumulative returns.


Consumer staples sector (XLP) seems to be the best investment. (Annualized return:9.65% with Sharpe ratio is 0.7015)

           
XLB XLE XLF XLP XLI XLU XLV XLK XLY
Annualized Return 0.0942 0.0935 0.0598 0.0965 0.104 0.1117 0.0948 0.1095 0.1089
Annualized Std Dev 0.2352 0.2767 0.3182 0.1298 0.2009 0.1724 0.1604 0.2 0.2048
Annualized Sharpe (Rf=0.5%) 0.3772 0.3181 0.1712 0.7015 0.4905 0.6158 0.5567 0.5197 0.5045


Correlation Matrix Chart
             "XLB", #SPDR Materials sector
             "XLE", #SPDR Energy sector
             "XLF", #SPDR Financial sector
             "XLP", #SPDR Consumer staples sector
             "XLI", #SPDR Industrial sector


Tree Chart

             "XLB", #SPDR Materials sector
             "XLE", #SPDR Energy sector
             "XLF", #SPDR Financial sector
             "XLP", #SPDR Consumer staples sector
             "XLI", #SPDR Industrial sector
             "XLU", #SPDR Utilities sector
             "XLV", #SPDR Healthcare sector
             "XLK", #SPDR Tech sector
             "XLY", #SPDR Consumer discretionary sector


XLF (Finance sector) is connected to XLU (Utilities sector) and XLE (Energy sector)