Translate

Thursday, August 31, 2017

S&P/Case-Shiller MSA Home Price Index (Seasonal Adjusted) (1987/01/01=1.00) as of 6/2017

 The following charts display the S&P/Case-Shiller MSA Home price Index (1987/01/01 =1.00)  of several cities in the United States as of June, 2017. The home prices in many cities recover from the bottom caused by the financial crisis in 2007.

If you have purchased a home with $100K in the following cities in January 1987, then the value of house would be as of June 2017

San Fransco (506 K) > Los Angeles (439K ) > San Diego (438 K)  > Denver (392K) > DC (341K) > Miami (327K)> Boston (284K) > Chicago (255K) > New York(254K) > Las Vegas (243K)


Source: http://us.spindices.com/index-family/real-estate/sp-corelogic-case-shiller


Tuesday, August 29, 2017

Ratios of U.S. corporate profits by industry


Correlation Matrix

The following chart shows the correlation matrix of ratios of profits by industry in total domestic profit.

The finance industry is positively correlated with retail industry and is negatively correlated with other industries.

The manufacturing industry is positively correlated with transportation and wholesale industries and is negatively correlated with retail.

The transportation industry is positively correlated with the manufacturing industry.

The information industry is positively correlated with the transportation industry.
 The following chart shows the historical ratios of profits by industry in total U.S. corporate profits.
The following chart shows the ratio of finance industry (excluding the Fed) in all industry (excluding the profits from rest of world)


The following chart shows the ratio of manufacturing industry in all industry (excluding the profits from rest of world)

Monday, August 28, 2017

Corporate profits with inventory valuation and capital consumption adjustments: Rest of the world

The following chart shows the relationship between movements of dollar and U.S. corporate profits from rest of the world. They move opposite direction. 


The profits of U.S. corporates from rest of the world had been increasing tremendously, but staying flat lately. 


However, the growth rates of U.S. corporate profits from rest of the world had been slow down. It actually decreased from 2014 to 2016 when the Fed began to tighten the monetary policy.
The following chart shows the portion of U.S. corporate profits from rest of world in total U.S. corporate profits and it is growing which indicates the profits of U.S. corporates depend on more other countries.


Source: https://fred.stlouisfed.org/series/B394RC1Q027SBEA

Wednesday, August 23, 2017

Average Hourly Earnings of All employees

Six reasons why Average Houring Earnings are not rising fast 

1. Boomers and Millennials - Higher-paid baby boomers are retiring and being replaced by younger and less experienced workers who start at lower salaries
2. Global labor market creates price controls - Americans are directly or indirectly competing in a worldwide pool of workers like never before.
3. "Price" Control -Not government-mandated controls, Stiff global competition caps U.S. wages by preventing companies from raising prices to cover higher labor costs
4.Technology progress - Technological advances have spawned a new revolution in business models that dramatically lower costs, including the price of labor
5.Recession scars -The great recession of 2007-2009 made Americans less secure and more fearful of losing their jobs, leading them to move around less frequently and be less aggressive in seeking higher pay.
6.Low productivity - productivity has been unusually weak. it grew an average of 1.1% from 20077 to 2016.


Annual Changes from same period in previous year

Annual Changes

NOTE: For 2017, the data is as of July 2017


Source: https://fred.stlouisfed.org/series/CES0500000003
http://www.marketwatch.com/story/six-reasons-why-most-americans-arent-getting-big-pay-raises-2017-08-22

Saturday, August 19, 2017

Weibo Stock

요즈음 중국 IT 기업들의 주가가 미국의 FAANG (Facebook, Apple, Amazon, Netflix and Google) 보다 더 잘나가고 있습니다. 그중에 하나가 웨이보기업 (Weibo) 인데 작년까지 불가 $20 내외였는데 현재 $90 가까이 상승했습니다. 거의 4배가 올랐습니다. 


Friday, August 18, 2017

Industrial Production Index (INDPRO)


library(zoo)
library(quantmod)
library(TTR)
library(forecast)
library(ggfortify)
library(psych)
library(pastecs)
library(xts)

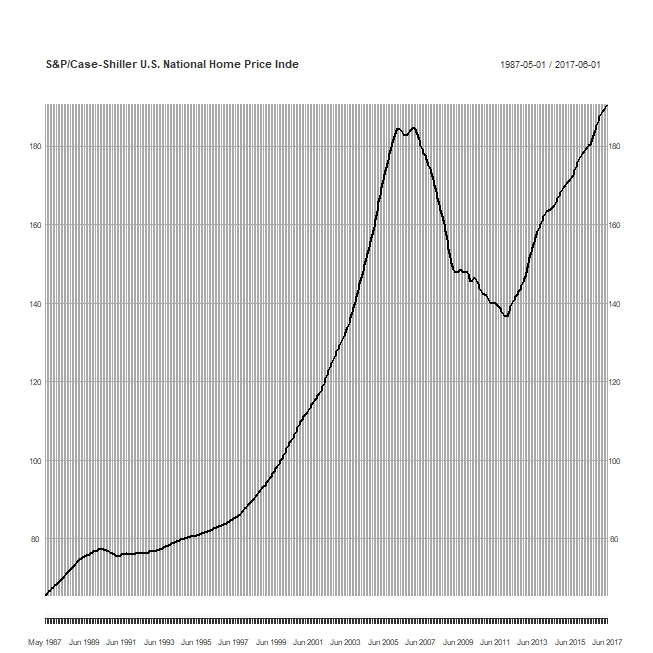
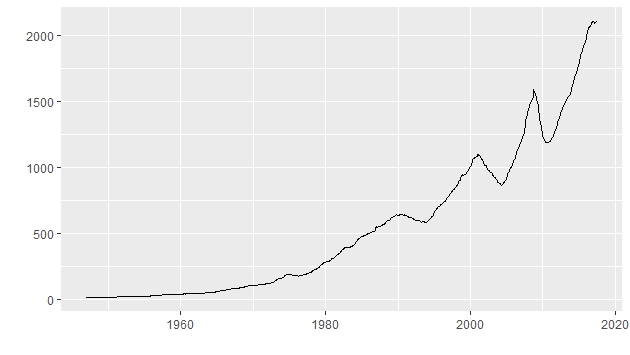
getSymbols('INDPRO', src='FRED')

mydata=INDPRO

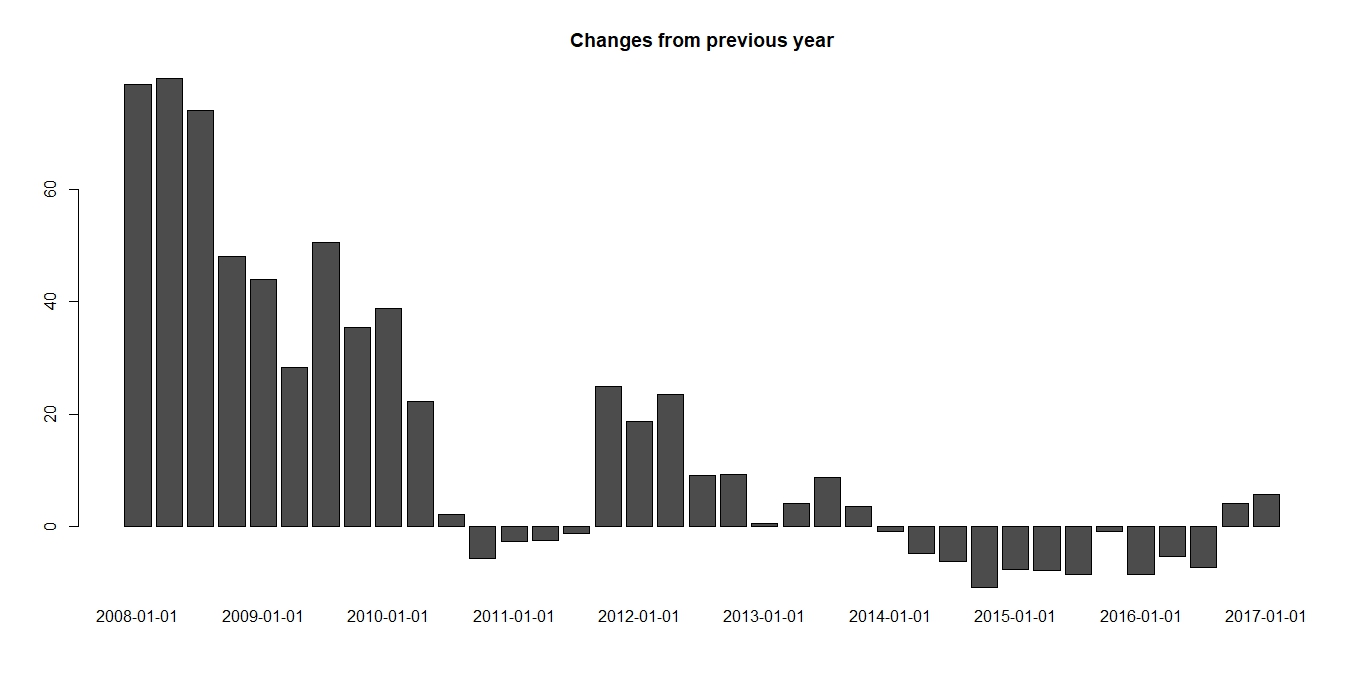
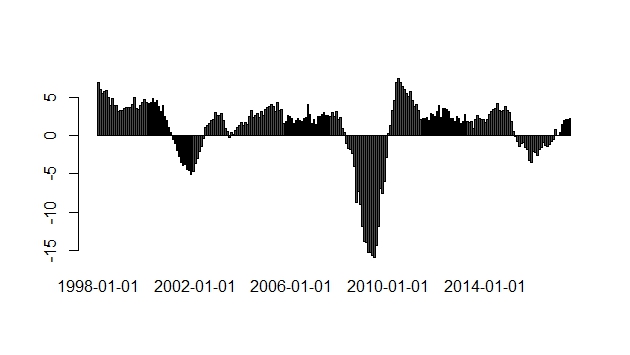
Annual<-annualReturn(mydata)*100
barplot(last(Annual, '20 year'), main='Annual Changes')
tail(Annual)

 yearly.returns
2012-12-01      2.3161888
2013-12-01      2.0991660
2014-12-01      3.1831880
2015-12-01     -3.2541923
2016-12-01      0.8255124
2017-07-01      1.6461802 (as of July 2017)


# Annual changes from 1998 to July 2017
the industrial production index increased by 1.65% in 2017 as of July 2017.


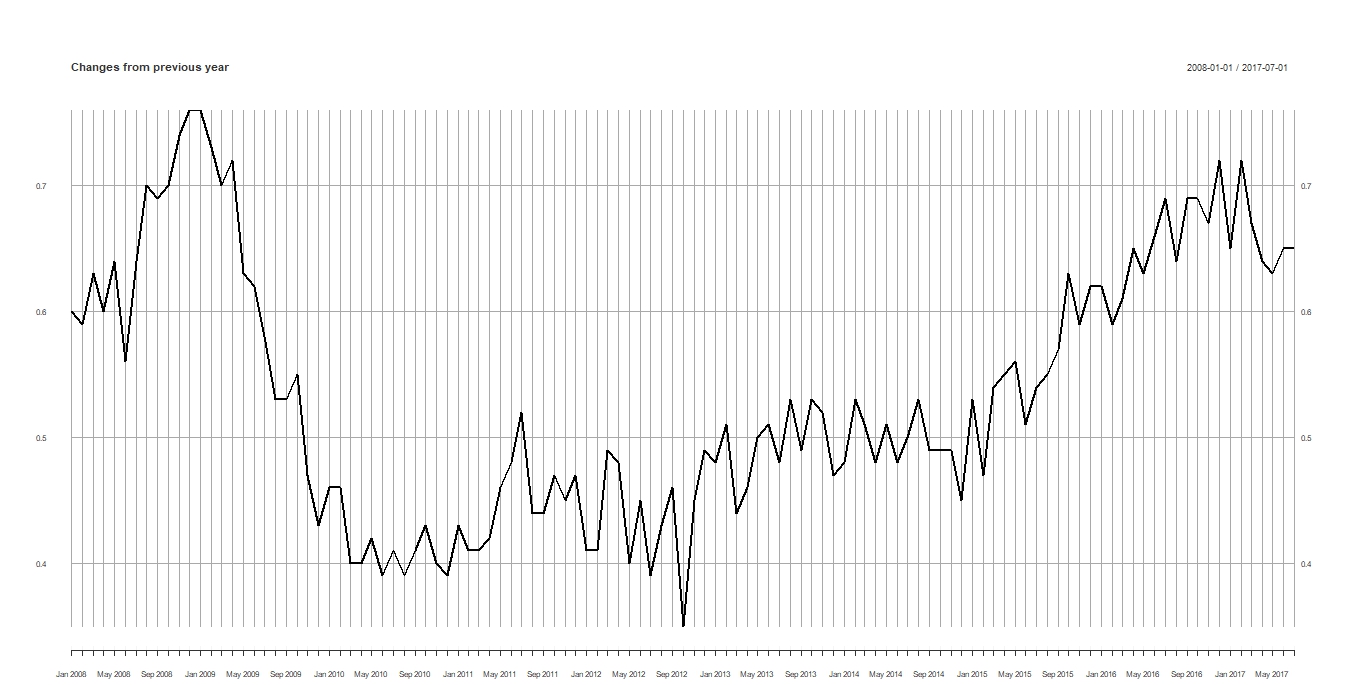
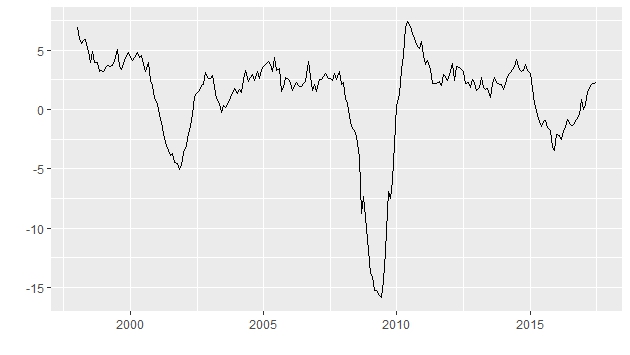
Diff_Year=diff(mydata,lag=12)
barplot(last(Diff_Year, '20 year'))
Industrial production index begins to increase positively from January 2017.
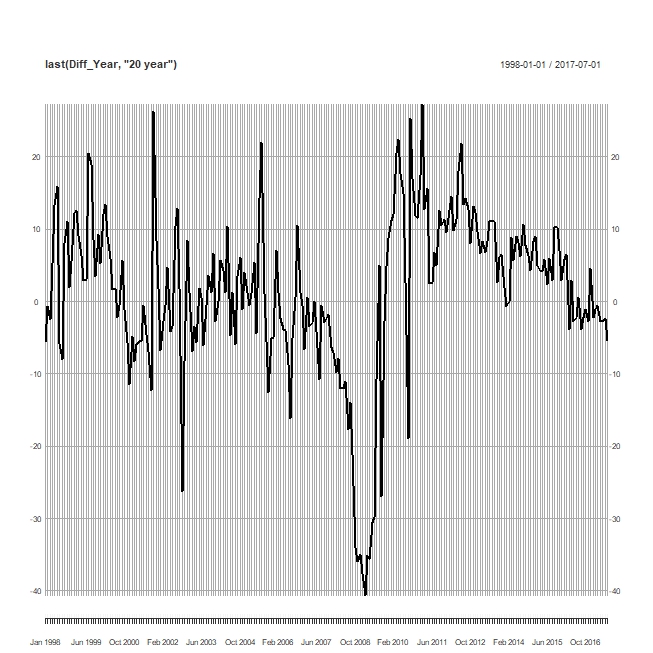
autoplot(last(Diff_Year, '20 year'))
 summary(last(Diff_Year, '20 year'))

     Index                INDPRO        
 Min.   :1998-01-01   Min.   :-15.8834  
 1st Qu.:2002-11-16   1st Qu.:  0.0678  
 Median :2007-10-01   Median :  2.2094  
 Mean   :2007-10-01   Mean   :  1.0568  
 3rd Qu.:2012-08-16   3rd Qu.:  3.3462  
 Max.   :2017-07-01   Max.   :  7.4406  
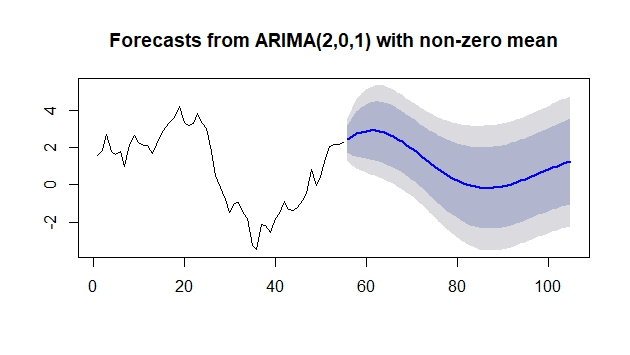
#forecasting

fit<-arima(last(Diff_Year, '5 year'), order=c(2,0,1))
accuracy(fit)
forecast(fit,50)
plot(forecast(fit,50))


Source: https://fred.stlouisfed.org/series/INDPRO


Thursday, August 17, 2017

Emerging Stock Markets Leverage 3X ETFs


The emerging stock markets:

EDC (Direxion Daily MSCI Em Mkts Bull 3X ETF (EDC))

RUSL (Direxion Daily Russia Bull 3X Shares(RUSL)) 

YINN (Direxion Daily FTSE China Bull 3X ETF (YINN))

BRZU (Direxion Daily MSCI Brazil Bull 3X ETF (BRZU))

INDL (Direxion Daily MSCI India Bull 3X Shares )


If you have invested $1.00 at the beginning of year, then the returns would be following: India would the highest yield among emerging countries.

           EDC.Close RUSL.Close YINN.Close BRZU.Close INDL.Close
2017-08-10  1.703108  0.7183414   1.611931   1.011147   1.752255
2017-08-11  1.720110  0.7172208   1.619628   1.040188   1.789659
2017-08-14  1.772395  0.7162869   1.661963   1.044881   1.859186
2017-08-15  1.775503  0.7209563   1.651058   1.077442   1.839824
2017-08-16  1.831810  0.7293612   1.724182   1.117630   1.914631
2017-08-17  1.758318  0.7259993   1.622835   1.058082   1.853685


Wednesday, August 16, 2017

Five ETFs associated with crude oil


There are five types of ETFs that you can invest associated with crude oil prices: USO, UCO, OIL,  SCO and DNO

When the crude oil prices are expected to rise, you can buy these ETFs:

USO - United States Oil 

UCO - Proshare Ultra Bloomberg Crude Oil 

OILPath Goldman Sachs Crude Oil Total Return (OIL)

When the crude oil prices are expected to decline, you can buy these ETFs:

SCOProShares UltraShort Bloomberg Crude Oil (SCO)

DNO - United States Short Oil (DNO)

  The following chart displays the movement of ETFs since January 2017.

If you have invested $1.00 at the beginning of this year, then the gains as of 8/16/2017 are:         


     USO          UCO            OIL             SCO          DNO

0.8365385 0.6715950  0.7902439    1.251664     1.141328