Translate

Saturday, January 13, 2024

Unveiling Economic Trends: A Closer Look at the Producer Price Index for December 2023

The Producer Price Index (PPI) data for December 2023 indeed provides a fascinating insight into the economic trends of the time. By breaking down the PPI into various categories like Final Demand, Final Demand Goods, and Final Demand Services, we can observe the different trajectories these segments are taking.


  1. Final Demand: The slight monthly decrease of 0.5% indicates a dip in prices at the final demand level, which could be due to various factors like changes in market demand, supply chain adjustments, or economic policies. However, the annual increase of 1.0% suggests a general upward trend in prices over the year, pointing towards a moderate inflationary pressure in the economy.

  2. Final Demand Goods: The more substantial monthly decrease of 1.1% and the annual decrease of 0.8% in this category is particularly noteworthy. It could be indicative of several factors, such as a decrease in raw material costs, improvements in production efficiency, or a shift in consumer preferences away from certain goods. The negative annual change is especially significant, as it contrasts with the overall trend in the Final Demand category.

  3. Final Demand Services: The resilience of the services sector is evident from the smaller monthly decline of 0.3% and the positive annual change of 1.8%. This could reflect a strong demand for services or an increase in the cost of providing these services. The positive annual change suggests that the services sector might be experiencing different economic pressures compared to the goods sector.

Overall, the PPI data for December 2023 highlights the complexities of the economic environment. The divergent trends in goods and services suggest that different

sectors of the economy are responding differently to prevailing economic conditions. This divergence can be influenced by various factors, such as sector-specific demand and supply dynamics, technological advancements, policy changes, and global economic trends.

For policymakers, understanding these nuances is crucial for effective economic planning and intervention. For instance, the decline in prices for Final Demand Goods might necessitate different policy responses compared to the resilience seen in the services sector.

For businesses, this data is instrumental in strategic planning. Companies in the goods sector might need to explore ways to enhance efficiency or adapt to changing market demands, while those in the services sector could focus on capitalizing on their growth potential.

Investors, on the other hand, can use this data to make informed decisions about where to allocate their resources. The contrasting trends between goods and services indicate different risk and return profiles, which could influence investment strategies.


In conclusion, the PPI data for December 2023 offers valuable insights for a range of stakeholders. It underscores the importance of closely monitoring economic indicators to understand the evolving market dynamics and make informed decisions. As the economy continues to navigate through various shifts, such data becomes even more critical in shaping the strategies of policymakers, businesses, and investors alike.


Thursday, January 11, 2024

Deciphering the Urban Pulse: Insights from December's CPI Data


The Consumer Price Index (CPI) serves as the economic heartbeat of urban America, providing a vital read on inflation and the cost of living. As we unpack the latest CPI data, the numbers bring into focus the varied inflationary pressures across different sectors.

A Granular View of CPI Changes

Overall CPI: The comprehensive measure of the CPI witnessed a monthly uptick of 0.3%, translating into an annual increase of 3.3%. This overarching figure sets the stage for a deeper dive into specific categories.


New Vehicles: Contrary to the overall trend, new vehicle prices dipped by 0.2% over the month, yet the year has seen a rise of 1.0%. This suggests a nuanced market where short-term price reductions haven't erased the long-term upward trend.

Food Essentials: The price of food in urban centers rose by 0.2% this month, with an annual growth of 2.7%. This indicates a steady increase in the cost of groceries that could impact household budgets.

Shelter: Perhaps the most significant hike was seen in shelter costs, with a monthly increase of 0.5% and a substantial 6.2% rise over the year. The figures underscore a growing concern around housing affordability.

Home Cooking vs. Dining Out: Food at home posted a modest 0.1% monthly rise, with a yearly increase of 1.3%. In contrast, eating out became 0.3% more expensive this month and has seen a sharper annual increase of 5.2%.

Energy Sector: Energy costs increased by 0.4% in the short term but displayed a yearly decrease of 2.0%. This dichotomy may reflect the volatile nature of energy prices and their sensitivity to global events.

Healthcare Costs: Medical care expenses rose by 0.6% this month, but the yearly change is minimal at 0.4%. Medical services saw a more considerable monthly increase of 0.7%, though the annual figure dipped by 0.5%, hinting at an unpredictable healthcare market.

Housing Expenses: The general housing index edged up by 0.3% monthly, with a significant 4.8% yearly increase. Rent, a key component, mirrored this trend with a 6.5% annual upsurge, highlighting the cost pressures faced by renters.

Education and Communication: This category shows a year-on-year decrease of 0.1%, despite a slight monthly rise of 0.1%. This could signal a shift in consumer behavior or an adjustment in service offerings.

Economic Implications and Lifestyle Adjustments

The CPI data paints a picture of an urban economy where housing and dining out are becoming increasingly expensive. While the energy sector's prices fluctuate, healthcare costs seem to be in a state of flux. For urban consumers, these statistics may call for recalibrated household budgets, especially regarding rent and food expenses. As inflationary patterns shift, staying informed and adaptable is crucial for economic resilience.


Wednesday, January 10, 2024

Exploring the Impact of Inflation Regimes on Monetary Policy

In the fascinating world of economics, understanding how monetary policy influences the economy under varying inflation conditions is crucial. In a recent comprehensive study by Christopoulos, McAdam, and Tzavalis, presented in their paper "Economic Review V108 N4," we delve into this complex relationship.

High Inflation vs. Low Inflation: A Different Game

The study reveals a striking difference in the economy's response to federal funds rate changes during high and low inflation periods. Notably, when inflation expectations exceed approximately 4 percent, the economy reacts more sluggishly and unpredictably compared to times of low inflation.

The Challenge of Taming Inflation

One of the key insights is that high-inflation scenarios demand maintaining elevated interest rates for longer durations to effectively curb inflation. This contrasts sharply with low-inflation states, where shorter periods of interest rate adjustments suffice.

Methodology: Unveiling the Details

Employing a threshold vector autoregression model, the authors intricately dissect the distinct impacts of monetary policy across these different inflation regimes. This approach provides a nuanced understanding of the intricate interplay between inflation levels and policy responses.

Implications for Policy Makers and Economists

This study offers valuable insights for policy makers and economists. In times of high inflation, more robust and sustained monetary interventions are required. Understanding these dynamics is key to formulating effective policies that stabilize the economy and manage inflation efficiently.

In essence, Christopoulos, McAdam, and Tzavalis's work highlights the importance of considering the state of inflation when devising and implementing monetary policies. It's a crucial read for those interested in the mechanics of economic policy and its real-world implications.


Source: https://www.kansascityfed.org/research/economic-review/do-the-effects-of-interest-rate-changes-depend-on-inflation/

Friday, January 5, 2024

Navigating the December 2023 Employment Landscape: A Statistical Deep Dive

The labor market is a complex and dynamic ecosystem, reflecting the ebb and flow of economic trends. As we step into the new year, it's crucial to examine the latest employment situation, particularly the data for December 2023. This information, released on January 5, 2024, provides insights into various key indicators shaping the workforce landscape.


1. Labor Force Participation Rate: A Slight Dip

The Labor Force Participation Rate, which gauges the percentage of working-age individuals actively engaged in the workforce, experienced a marginal decline of 0.48%. While this dip may seem negligible, it warrants attention as it suggests a slight contraction in the pool of active job seekers.

2. Employment-Population Ratio: A Steady State

The Employment-Population Ratio, reflecting the proportion of the population currently employed, remained relatively stable, exhibiting a slight decrease of 0.50%. Despite this decline, the rate stands resilient at a consistent level.

3. Unemployment Rate: Holding Steady with a Twist

Surprisingly, the Unemployment Rate showed no change in the monthly percentage, standing at 0.00%. However, the annual perspective reveals a 5.71% increase, indicating a nuanced employment landscape that may have evolved over the course of the year.

4. Population Level: A Modest Uptick

The overall population witnessed a marginal increase of 0.06%. While seemingly small, this growth is noteworthy as it contributes to the broader demographic context within which employment trends unfold.

5. Civilian Labor Force Level: A Slight Contraction

The Civilian Labor Force Level, representing the total number of individuals either employed or actively seeking employment, contracted by 0.40%. This dip may suggest a moderation in the labor force's size.

6. Employment Level: A Marginal Decline

Reflecting the number of individuals currently employed, the Employment Level saw a slight decrease of 0.42%. This dip, while subtle, aligns with the minor contractions observed in related indicators.

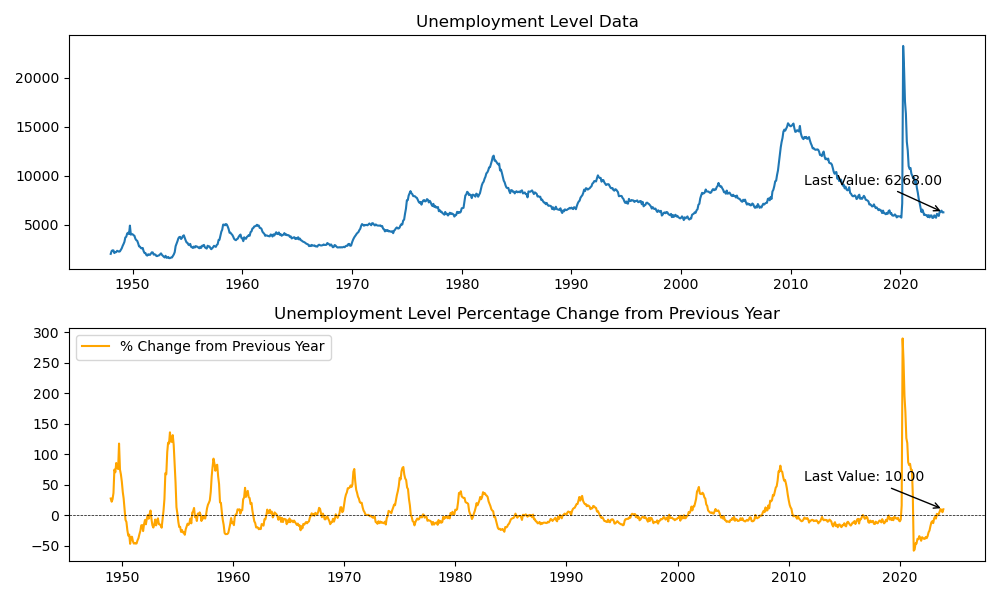
7. Unemployment Level: A Notable Uptick

Conversely, the Unemployment Level experienced a 0.10% increase, translating to a 10.00% annual change. This rise in unemployment suggests challenges within the job market, potentially influenced by broader economic shifts.

8. Not in Labor Force: An Increase with Nuances

The category of individuals not in the labor force, often comprising retirees, students, and those choosing not to participate actively, witnessed a notable 0.85% increase. Additionally, those not in the labor force but actively seeking employment rose by 6.14%, marking a considerable annual change of 9.97%.


In summary, the December 2023 employment data presents a mixed bag of indicators. While some aspects, such as the stable Unemployment Rate, provide a sense of continuity, subtle shifts in other metrics suggest underlying changes in the labor market. As we navigate through the intricacies of these statistics, it becomes imperative for policymakers, businesses, and individuals alike to adapt strategies that align with the evolving dynamics of the workforce landscape.