Translate

Saturday, February 25, 2017

Consumer Price Index for All Urban Consumers by Types


The following chart displays the different types of consumer price index; Rent (Housing), Food and Beverage, Apparel and Medicare. These are very critical goods and services that consumers need to purchase under any circumstance. The prices of two necessary consumptions (Housing and Medical) have been increasing at upper 3% annually while the prices of two other items (Food and Beverage and Apparel) have been actually declining. 

The demand for housing and medical is very inelastic which means the demand for these good does not change as much as prices change. So, the consumers still have to pay high prices although the prices increases. However, the demand for foods and apparel is very elastic and the markets for these goods are also very competitive.  Therefore, if the prices of these goods rise high then demand for these goods declines.


Bureau of Labor Statistics
Source:
https://fred.stlouisfed.org/graph/?graph_id=364412

Saturday, February 4, 2017

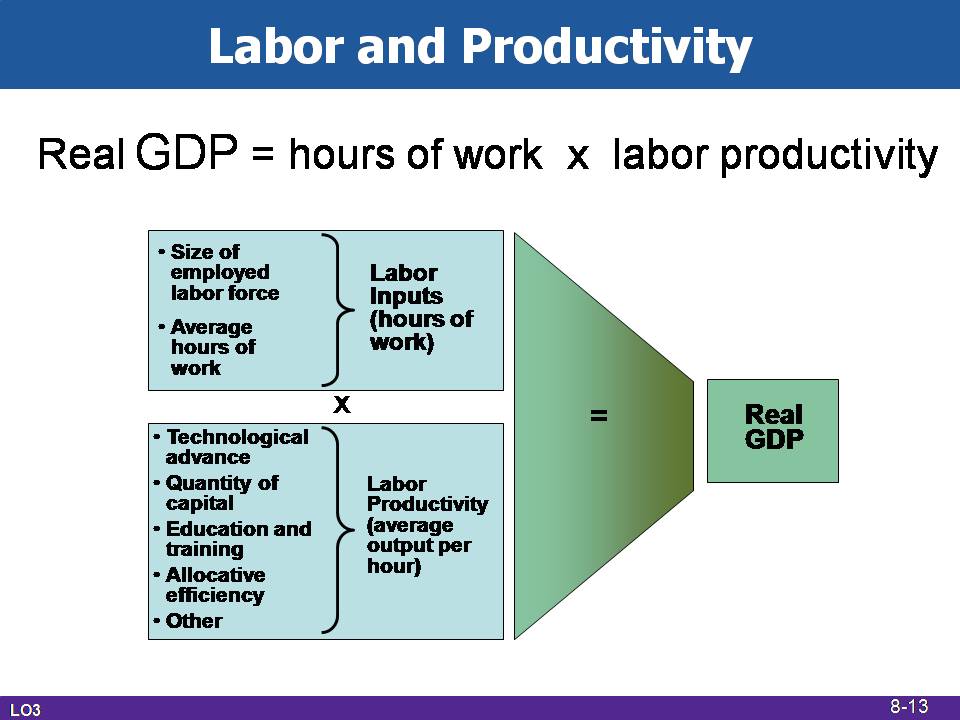
Labor and Productivity


Society can increase its real output and income in two fundamental ways: (1) by increasing its inputs of resources and (2) by raising the productivity of those inputs.
There are five factors that appear to explain changes in productivity growth rates: 
  • Technological Advance - Approximately 40%
  • Quantity of Capital-Approximately 30% 
  • Education and Training-Approximately 15%
  • Economies of Scale  and Improved Resource Allocation -Approximately 15%


Thursday, January 26, 2017

Gross Domestic Product from 1970 to 3rd Quarter 2016

There are four components in the Gross Domestic Product (GDP): Personal Consumption Expenditures, Gross Private Domestic Investments, Government Spending and Net Exports of goods and services. The share of personal consumption expenditures is more than 60% and its share in the GDP has been gradually increasing.  The next biggest share in the GDP is the government spending and its share is approximately less than 20% and its share has been gradually declining over the time. The share of private domestic investments is about 17% of the GDP and its share has been pretty stable. The net exports of goods and services take approximately 3-4% in the GDP and its share in the GDP was increasing during the 1990s and 2000s, but it has been declining since the great recession.