Translate

Thursday, January 25, 2024

Title: Analyzing the Economic Landscape: Real GDP Growth Rates for Q4 2023


Introduction: The economic landscape is constantly evolving, shaped by various factors ranging from consumer spending to government investments. In this blog post, we delve into the real GDP growth rates for the fourth quarter of 2023, shedding light on key indicators such as Real Gross Domestic Product (GDP), Real Personal Consumption Expenditures, Real Exports and Imports of Goods and Services, as well as Real Government Consumption Expenditures and Gross Investment. Let's explore what these figures reveal about the state of the economy.

  1. Real Gross Domestic Product (GDP): 3.30 Real GDP is a fundamental measure of a country's economic performance. In the fourth quarter of 2023, the Real GDP growth rate stood at 3.30%. This indicates a positive trajectory for the overall economic output, suggesting increased production and consumption of goods and services.


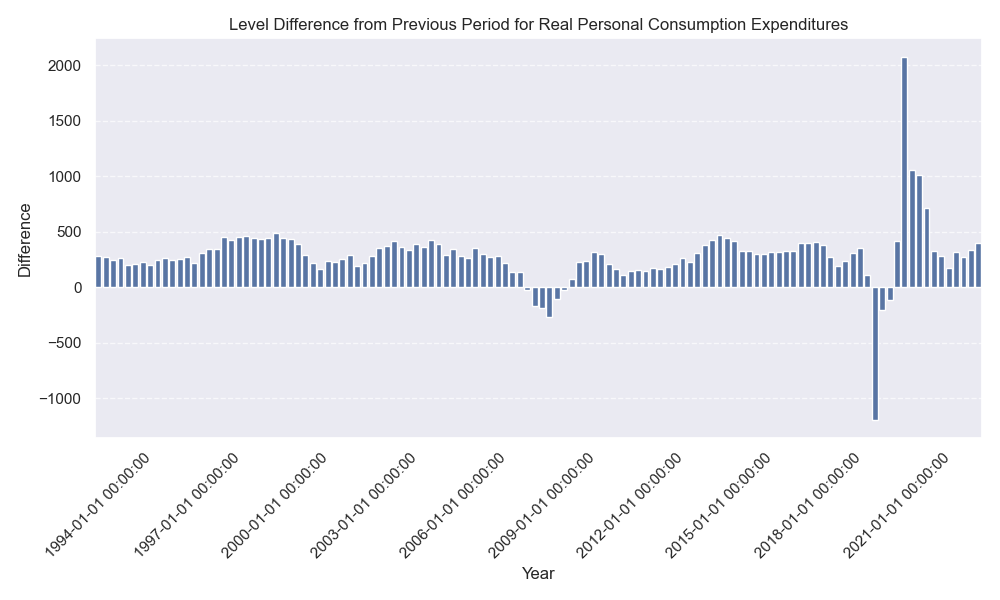
  2. Real Personal Consumption Expenditures: 2.80 Consumer spending plays a pivotal role in economic growth. The Real Personal Consumption Expenditures (PCE) growth rate for Q4 2023 is recorded at 2.80%. This suggests that individuals are contributing significantly to economic expansion through their purchases of goods and services.


  3. Real Exports of Goods and Services: 6.30 The international trade landscape is a crucial aspect of economic health. With a Real Exports growth rate of 6.30%, the fourth quarter of 2023 saw a substantial increase in the demand for goods and services produced domestically. This growth is indicative of a competitive global market.


  4. Real Imports of Goods and Services: 1.90 While exports are crucial, so are imports, as they reflect the demand for foreign goods and services within the domestic market. The Real Imports growth rate for Q4 2023 is 1.90%, suggesting a moderate increase in the consumption of foreign products.


  5. Real Government Consumption Expenditures and Gross Investment: 3.30 Government spending and investment contribute significantly to economic activity. In the fourth quarter of 2023, the Real Government Consumption Expenditures and Gross Investment grew by 3.30%, indicating a commitment to stimulating economic growth through public-sector initiatives.


  6. Real Gross Private Domestic Investment: 2.10 Private sector investments are essential for sustained economic growth. The Real Gross Private Domestic Investment grew by 2.10% in Q4 2023, reflecting positive sentiment among businesses and investors.

Conclusion: In conclusion, the real GDP growth rates for the fourth quarter of 2023 paint a picture of a growing and dynamic economy. With positive indicators across various sectors, including personal consumption, exports, and government spending, the outlook is optimistic. However, it's important to monitor these trends over time to gain a comprehensive understanding of the economic landscape and identify potential challenges and opportunities.


Title: Analyzing the Latest Trends in New Residential Sales - December 2023


The housing market is a crucial economic indicator, reflecting the overall health of the economy. The latest data on new residential sales for December 2023, released today, provides valuable insights into the current state of the housing market in the United States. In this blog, we'll delve into key indicators, examining both monthly and annual percentage changes with a focus on trends and implications.

  1. Median Sales Price of Houses Sold:

    • Monthly Change: -4.1%
    • Annual Change: 16.4%

    The median sales price has seen a slight decrease on a monthly basis but exhibits a robust annual growth of 16.4%, indicating a positive trend in property values.

  2. Average Sales Price of Houses Sold:

    • Monthly Change: -5.7%
    • Annual Change: 21.9%

    The average sales price also experienced a dip in the short term but maintains a significant annual increase, suggesting a strong market.

  3. Houses Sold by Cash Purchase:

    • Monthly Change: -23.5%
    • Annual Change: 30.0%

    Cash purchases have shown a substantial monthly decline but have surged by 30% annually, signifying a shift in financing preferences.

  4. New Houses Sold by Sales Price:

    • Monthly Change: 19.0%
    • Annual Change: 6.4%

    The number of new houses sold has increased significantly in the short term, with a moderate annual growth rate, reflecting changing consumer behavior.

  5. New Houses for Sale - Completed:

    • Monthly Change: 6.6%
    • Annual Change: 22.7%

    Completed new houses for sale have experienced positive growth both monthly and annually, indicating a healthy demand for ready-to-move-in properties.

  6. Monthly Supply of New Houses:

    • Monthly Change: -6.8%
    • Annual Change: -3.5%

    The supply of new houses has slightly decreased on a monthly basis, but the annual change remains negative, suggesting a potential tightening of inventory.

  7. Median Number of Months on Sales Market for Completed Homes:

    • Monthly Change: -3.7%
    • Annual Change: 36.8%

    Newly completed homes spend fewer months on the market on a monthly basis, with a considerable annual increase, indicating a faster turnover.

  8. New One Family Houses for Sale:

    • Monthly Change: -0.9%
    • Annual Change: -0.4%

    The number of new one-family houses for sale has seen a marginal decrease both monthly and annually.

  9. New One Family Houses Sold:

    • Monthly Change: 8.0%
    • Annual Change: 4.4%

    The sales of new one-family houses have shown positive growth both on a monthly and annual basis, contributing to a dynamic market.

  10. Median Sales Price for New Houses Sold:

    • Monthly Change: -3.0%
    • Annual Change: -13.8%

    The median sales price for new houses sold has experienced a slight decline in the short term and a significant drop annually.

Conclusion:

The latest data on new residential sales in December 2023 paints a mixed picture of the housing market, with some indicators showing positive trends while others exhibit short-term fluctuations. These insights can be valuable for potential homebuyers, sellers, and policymakers in navigating the current real estate landscape. As we move into the new year, keeping a close eye on these indicators will be crucial for understanding the evolving dynamics of the housing market.


Analyzing the Trends in New Residential Construction for December 2023


As we wrap up the year 2023, it's crucial to take a closer look at the latest data on new residential construction. The figures for December provide insights into the housing market, reflecting changes in various categories. Let's delve into the key findings with a focus on the monthly and annual percentage changes, presented with one decimal point precision.

Total New Housing Units Started

  • Monthly Change: -4.3%
  • Annual Change: 7.6%

The total number of new privately-owned housing units started in December 2023 experienced a modest decline of 4.3% compared to the previous month. However, on an annual basis, there was a positive growth of 7.6%, indicating a steady upward trend in the construction of new housing units.

Authorized Units in Permit-Issuing Places

  • Monthly Change: 1.8%
  • Annual Change: 6.0%

The data reveals a slight increase of 1.8% in the number of authorized housing units in permit-issuing places for December. On an annual basis, this category demonstrates a positive change of 6.0%, suggesting ongoing demand for new housing in these areas.

Single-Family Units Construction

  • Monthly Change: -8.6%
  • Annual Change: 15.8%

In the single-family units category, there was a notable monthly decrease of 8.6%. However, the annual change paints a more optimistic picture, showing a substantial increase of 15.8%. This could be indicative of a shift towards larger housing projects.

Units Under Construction and Completed

  • Under Construction - Monthly Change: -0.4%
  • Under Construction - Annual Change: -1.0%
  • Completed - Monthly Change: 8.7%
  • Completed - Annual Change: 13.2%

The number of new housing units under construction experienced a marginal monthly decline of 0.4%, with a slight annual decrease of 1.0%. On the other hand, completed housing units saw a robust monthly increase of 8.7% and a solid annual change of 13.2%, reflecting successful project completions.

Insights into Specific Unit Categories

  • Units in Buildings with 5 or More Units - Monthly Change: 0.2%

  • Units in Buildings with 5 or More Units - Annual Change: 7.4%

  • Single-Family Units Authorized - Monthly Change: 2.3%

  • Single-Family Units Authorized - Annual Change: 33.6%

  • Single-Family Units Under Construction - Monthly Change: -1.2%

  • Single-Family Units Under Construction - Annual Change: -11.4%

  • Single-Family Units Completed - Monthly Change: 8.4%

  • Single-Family Units Completed - Annual Change: 6.1%

  • Units in Buildings with 5 or More Units Authorized - Monthly Change: 0.5%

  • Units in Buildings with 5 or More Units Authorized - Annual Change: -27.3%

  • Units in Buildings with 5 or More Units Completed - Monthly Change: 11.1%

  • Units in Buildings with 5 or More Units Completed - Annual Change: 33.6%

Other Notable Trends

  • Authorized but Not Started - Monthly Change: -1.6%

  • Authorized but Not Started - Annual Change: -10.0%

  • Units in Buildings with 2-4 Units Started - Monthly Change: 23.1%

  • Units in Buildings with 2-4 Units Started - Annual Change: 77.8%

  • Units in Buildings with 5 or More Units Started - Monthly Change: 7.5%

  • Units in Buildings with 5 or More Units Started - Annual Change: -9.5%

In summary, the new residential construction data for December 2023 presents a nuanced picture of the housing market. While some categories experienced monthly fluctuations, the overall annual trends indicate resilience and growth in certain segments. These insights are valuable for stakeholders in the real estate and construction industries as they navigate the dynamics of the housing landscape in the coming year.