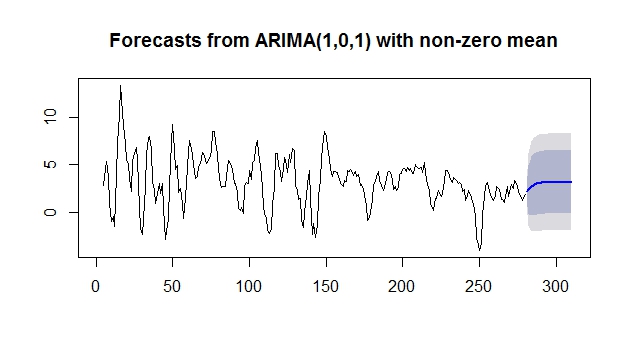
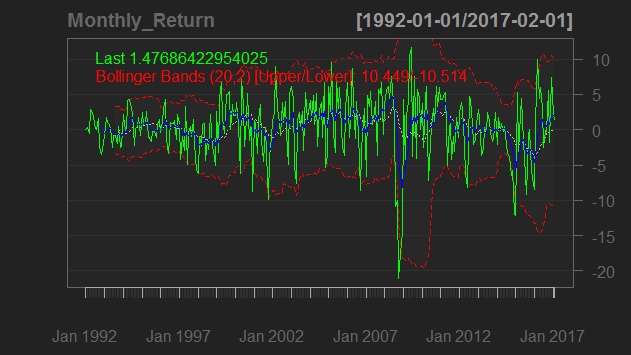
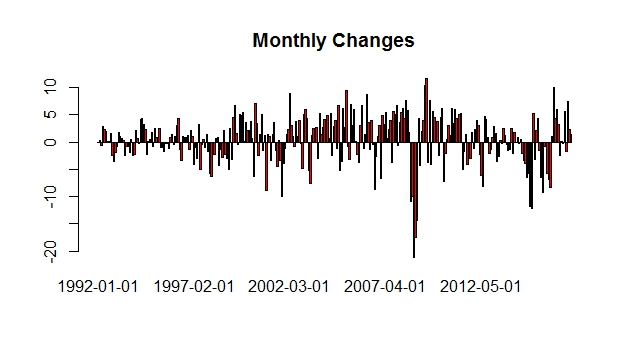
The forecasting model ARIMA (1,0,1) projects the annualized real GDP rates at 3% for next several quarters.
My objective is to simplify and clarify economics, making it accessible to everyone. It is important to remember that the opinions expressed in my writing are solely my own and should not be considered as financial advice. Any potential losses incurred from acting upon the information provided in my writing are the responsibility of the individual, and I cannot be held liable for them.
Translate
Wednesday, March 29, 2017
Tuesday, March 28, 2017
Median Number of Months on Sales Market for Newly Completed Homes and Home Price
The relationship between Median Number of Months on Sales Market for Newly Completed Homes and S&P/Case -Shiller U.S. National Home Price. It only takes 3.4 months to sell the new homes so that the home price has been increasing above 5%.
Exchange Rate vs. Real Exports
Exchange Rate vs. Real Exports of Goods and Service
Two variables have negative relationship: Exchange Rate and Real Exports. These two variables move opposite direction.
Sunday, March 26, 2017
Global Price Index of All Commodities
Global Price Index of All Commodities is currently rising. This means the demand is back and the inflation is back as well.
Source: https://fred.stlouisfed.org/series/PALLFNFINDEXM
Friday, March 24, 2017
Personal Consumption Expenditures: Chain-type Price Index (PCEPI)
Technical analysis of monthly changes of PCE:
PCE from 1/2010
Tuesday, March 21, 2017
Federal government current tax receipts: Taxes on corporate income
Federal government current tax receipts: Taxes on corporate income (B075RC1Q027SBEA)
Source: https://fred.stlouisfed.org/series/B075RC1Q027SBEA
Thursday, March 16, 2017
Historical U.S. Real GDP Growth Rates - Bar Chart created by R
The following R codes can generate the chart below. The code will bring the real GDP data from St Louis Fed website directly.
library (quantmod)
getSymbols('GDPC1', src='FRED' )
mydata2<-annualReturn(GDPC1)*100
barplot(mydata2, main='Real GDP Growth', col='red', xlab='Year')
Subscribe to:
Comments (Atom)


