Translate

Wednesday, April 30, 2025

Stagflation Watch: Q1 2025 GDP & Inflation Data Suggest an Emerging Policy Dilemma

Stagflation Watch: Q1 2025 GDP & Inflation Data Suggest an Emerging Policy Dilemma

The advance estimate of U.S. real GDP for Q1 2025 reveals a contraction of –0.3% (annualized)—the first negative print since the 2022 slowdown. Simultaneously, core PCE inflation accelerated to 3.5%, up from 2.6% the previous quarter.

While not a textbook case of stagflation—yet—the macro mix is concerning:

  • Headline GDP shrank, driven by a surge in imports (drag), a decline in federal defense spending, and a deceleration in consumption
  • Private domestic final sales rose +3.0%, showing some resilience in private demand
  • Inflation remains sticky, particularly in services, with healthcare and housing/utilities as key drivers

Historical Parallel:
In 1974 Q1, the U.S. economy contracted by –2.3% while core CPI exceeded 9%, a classic stagflationary period driven by oil shocks and monetary overhang.

Today’s Scenario:

  • GDP drag is structural: rising goods imports (notably pharmaceuticals and computer components) and declining defense outlays
  • Inflation is demand-persistent: elevated PCE in non-energy services, not supply-constrained sectors
  • BEA adjustments excluded silver bar imports from investment, reflecting heightened investor hedging activity—another inflation signal

Implication for Policymakers:

  • Monetary easing is constrained by upward inflation momentum
  • Fiscal space is limited due to political pressures and defense reprioritization
  • The Fed may enter a stagflation-style trap: tightening risks recession, while easing risks credibility loss

This evolving data landscape warrants close monitoring of core inflation drivers, real income trends, and inventory cycles as forward indicators.

Your take? Is this a soft-patch in a rebalancing cycle, or the front edge of a sustained stagflation regime?

#Stagflation #Macroeconomics #USGDP #PCE #Inflation #BEA #FederalReserve #EconomicPolicy #RecessionRisks #EconomicOutlook #Markets #RealEconomy

U.S. Economy Contracts in Q1 2025, But Private Demand Holds Up


The advance GDP estimate released by the Bureau of Economic Analysis shows that the U.S. economy shrunk by -0.3% (annualized) in Q1 2025—marking the first quarterly contraction since the 2022 slowdown.

Despite the negative headline number, underlying private sector strength remained:

  • Final sales to private domestic purchasers rose +3.0%
  • Private investment and consumer spending increased
  • Exports rebounded

However, a surge in imports (especially consumer and capital goods) and a drop in federal government spending, particularly in defense, outweighed domestic gains.

Inflation pressures also resurfaced:

  • Core PCE rose +3.5%, up from +2.6% last quarter
  • Headline PCE price index climbed +3.6%

This complex mix of softening GDP and sticky inflation will pose challenges for policymakers, especially the Federal Reserve as it weighs interest rate decisions in the coming months.

Key Takeaway: While headline GDP declined, private sector demand remains solid. The drag came largely from imports and federal cuts—not from a collapse in consumer or business activity.

#GDP #Economy #Inflation #BEA #FederalReserve #EconData #Markets #PrivateSector #InterestRates #LinkedInEconomy


Tuesday, April 29, 2025

February 2025 Home‐Price Trends: Tech Hubs Power Ahead, Florida Feels the Chill


 Released: April 29, 2025


The February 2025 S&P CoreLogic Case-Shiller release paints a market of contrasts. While long-term appreciation remains strongest in gateway metros, short-term momentum highlights a clear divide between resilient tech hubs and cooling Sunbelt areas. Here’s what you need to know:


1. Monthly Snapshot: Who’s Gaining—and Who’s Not

  • Tech Leaders Remain Unstoppable

    • San Francisco posted the largest single-month gain at +1.78%, followed closely by Seattle (+1.62%) and Los Angeles (+1.55%). High-income buyers and chronically low inventory continue to buoy these West Coast markets despite mortgage rates near 6.5%.

  • Selective Strength Beyond the Coast

    • Chicago (+0.59%), Boston (+0.39%), and Denver (+0.61%) all delivered solid monthly increases, suggesting that economic centers with diversified job bases still attract homebuyers.

  • Early Warning in Florida

    • Tampa (–0.34%) and Miami (–0.27%) were the only major metros to slip into negative territory, indicating possible seasonal oversupply or modest demand pullback as the peak moving season wanes.

  • Composites & the National Picture

    • The 10-City Composite rose +0.81%, and the 20-City Composite gained +0.71%, both comfortably outpacing the U.S. National Index (+0.41%)—underscoring how the largest markets continue to drive aggregate momentum.


2. Annual Gains: A Measure of Resilience

  • Top Performers

    • New York (+7.70%), Chicago (+6.95%), and Cleveland (+6.58%) lead the year-over-year pack, a testament to strong local economies and persistent housing shortages.

  • Broad Market Strength

    • Yearly appreciation in the 10-City (+5.18%) and 20-City (+4.50%) composites remains well above the National rate (+3.87%), highlighting that large-metro dynamics still dominate the broader national trend.

  • Underperformers

    • Tampa (–1.46%) is the lone metro with negative annual growth, while Dallas (+0.89%) and Denver (+1.59%) trail far below the national average—signs that some Sunbelt markets may have overshot fundamentals in 2023 and are now facing corrections.


3. What This Means Going Forward

  1. Momentum Divergence: Monthly data are an early signal—tech-center metros maintain strong short-term gains, but Florida’s pullback warns of localized overextension.

  2. Long-Run Resilience: Annual gains remain concentrated in gateway cities with constrained supply; however, even those rates will likely moderate as affordability pressures mount.

  3. Composite Metrics as Barometers: The gap between composite and national indices suggests that while large metros still lead, smaller markets are driving decelerations that composites only partially mask.

As we progress through 2025, rising rates, shifting remote-work patterns, and changing affordability will continue to reshape this landscape. Monthly readings like these will be essential for spotting early inflection points—whether you’re an investor sizing up portfolio allocations, a policymaker monitoring affordability, or a prospective buyer gauging the right market and timing for your next move.

Saturday, April 26, 2025

Two-Speed American Housing Market: New vs. Existing Homes in March 2025


In March 2025, U.S. housing data painted a tale of two distinct markets. While builders of new homes have largely adapted to softer demand through price cuts and incentive packages, existing homeowners have resisted downward pricing pressure—leading to widening gaps in supply, sales and pricing outcomes. This “two-speed” dynamic carries important implications for buyers, sellers and policymakers alike.


Key Takeaways

  • Supply surge vs. modest growth: Months-supply of existing homes jumped +25% YoY, versus just +1.22% for new construction.

  • Inventory buildup: Existing-home listings rose +19.82%, more than double the +8.35% gain for new units.

  • Sales divergence: New-home sales climbed +6% YoY (and +7.42% MoM), while existing-home sales fell –2.43% (and –5.85% MoM).

  • Price dynamics: Builders cut new-home prices –7.52%, but median existing-home prices rose +2.75%.


1. Supply & Inventory: Builders vs. Homeowners

A healthy market typically balances supply against buyer demand. In March:

Metric New Homes Existing Homes
Months Supply ΔYoY +1.22% +25.00%
Inventory ΔYoY +8.35% +19.82%
  • Builders’ response: Facing elevated mortgage rates and inventory backlogs, homebuilders have added stock cautiously—just an 8% rise in listings, and minimal months-supply growth.

  • Homeowner behavior: In contrast, existing homeowners have rushed to list properties—perhaps driven by equity-take-out, relocations, or fear of future rate hikes—resulting in a rapid 20% jump in available homes.

Implication: Surging existing‐home supply without corresponding demand risks a prolonged sales slump and inventory glut, while new construction may reach equilibrium sooner.


2. Sales Activity: Who’s Buying?

March sales figures tell a clear story of buyer preference:

Segment YoY Δ Sales MoM Δ Sales
New Homes +6.00% +7.42%
Existing Homes –2.43% –5.85%
  • New-home resilience: Attractive builder incentives (rate buydowns, closing-cost assistance) and modern features continue to draw buyers toward fresh construction.

  • Existing-home slowdown: Buyers appear deterred by sticker shock—median existing prices rose, even as listing inventory soared—leading to falling transaction volumes.

Implication: Builders who align pricing with affordability are moving units; existing sellers’ pricing disconnect is cooling activity.


3. Price Dynamics: Correction vs. Stickiness

Pricing trends highlight strategic choices:

Segment YoY Δ Price
New Homes –7.52%
Existing Homes +2.75%
  • Builders’ price cuts: To sustain cash flow and clear lots, many builders have slashed median new-home prices nearly 8% compared to a year ago.

  • Homeowners’ price holdout: Despite rising supply, existing-home sellers have mostly held line, pushing median prices up around 3%.

Implication: Unless existing-home prices adjust downward soon, buyers will continue to favor new construction, shifting market share toward builders.


4. Market Absorption & Friction

Beyond headline numbers, both segments face longer “time on market”:

  • Existing homes: Months-supply up +25% YoY signals slower absorption, likely extending days-on-market.

  • New homes: Months-supply grew just +1.2% YoY, but builders report a modest lengthening in order-to-delivery times.

Implication: Although builders have adapted, both markets are moving incrementally slower. Sellers and lenders should prepare for a more deliberate pace of transactions.


5. What Lies Ahead?

  1. Price realignment: The sharp divergence in price strategies suggests that existing-home prices may need to come down to reignite buyer interest.

  2. Builder advantage: Companies with nimble pricing and financing offers may capture a larger share of relocating and first-time buyers.

  3. Regional nuances: Markets with chronic inventory shortages (e.g., Sun Belt) may resist national trends, while oversupplied metros could see deeper corrections.

  4. Policy considerations: Local governments and housing authorities should monitor affordability metrics and consider incentives for both new and existing homeowners.


Conclusion

March 2025’s housing data underlines a bifurcated market. Builders who proactively adjust to economic headwinds are sustaining sales, while existing-home sellers holding firm risk languishing inventory. For prospective buyers, this “two-speed” environment offers opportunities in new construction—and potential bargains ahead in the resale market once price adjustments take hold. Sellers and policymakers alike will need to recalibrate expectations as this divergence continues to shape America’s housing landscape.


Tuesday, April 22, 2025

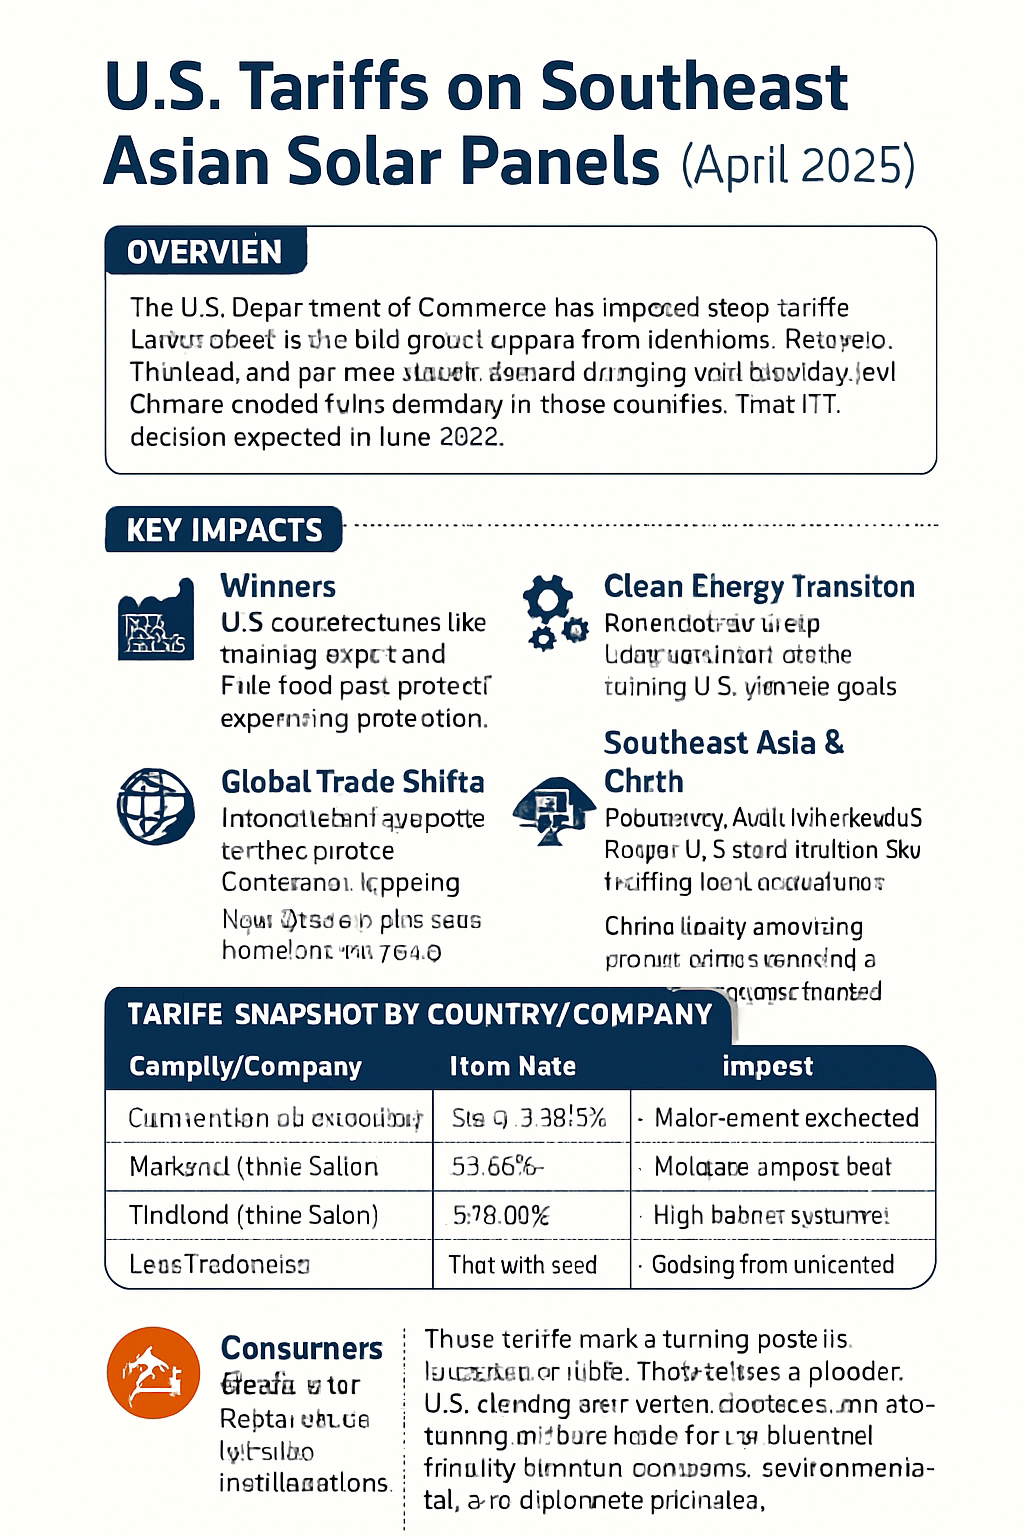
Title: U.S. Tariffs on Southeast Asian Solar Panels: A Turning Point in Clean Energy Trade

Published: April 22, 2025


In a significant shift in global trade and clean energy policy, the United States has finalized steep tariffs—reaching as high as 3,521%—on solar panel imports from Southeast Asia. These tariffs, announced on April 21, 2025, target Cambodia, Malaysia, Thailand, and Vietnam, countries that together accounted for more than 80% of U.S. solar imports last year.

The move is intended to protect domestic manufacturers like Hanwha Qcells and First Solar, who allege that Chinese-owned factories in Southeast Asia have been undercutting prices through unfair subsidies and dumping practices. While this protectionist measure may bolster American solar production, it raises serious questions about costs, international trade dynamics, and the future of the U.S. clean energy transition.


The Economic Divide: Protection vs. Affordability

On one side, U.S. manufacturers see this as a long-awaited corrective measure. The American Alliance for Solar Manufacturing Trade Committee praised the decision, arguing it levels the playing field and secures investments in domestic factories—many of which were incentivized under the Inflation Reduction Act.

But on the other side, solar developers warn that tariffs on imported solar cells, which are often assembled domestically, could sharply increase costs. This would likely slow the rollout of solar projects, impacting affordability for businesses and consumers alike.


Trade Shifts and Global Repercussions

The immediate effect of the tariffs has already surfaced: a drop in imports from the targeted countries and a rise in shipments from alternatives like Laos and Indonesia. As Chinese firms relocate operations to new regions to bypass tariffs, global supply chains are being reshaped in real time.

Countries like Cambodia and Thailand, heavily dependent on solar exports, now face economic headwinds. In particular, non-cooperative exporters from Cambodia are hit hardest, facing the maximum tariff rate.


Climate Goals in the Balance

While the intent behind the tariffs is rooted in economic fairness, the clean energy transition may take a hit. Higher prices could delay solar installations, hindering progress on climate targets. This is especially problematic at a time when the world is racing to reduce carbon emissions.

The tension between promoting domestic industry and accelerating renewable energy adoption is becoming increasingly visible. Whether subsidies or policy tweaks can bridge the gap remains to be seen.


Looking Ahead

The U.S. International Trade Commission (ITC) is set to deliver a final ruling on these tariffs in June 2025. Until then, stakeholders across the solar value chain—manufacturers, developers, international exporters, and climate advocates—are bracing for long-term shifts in how solar panels are sourced, priced, and deployed.

This is more than just a trade decision. It’s a pivotal moment that could redefine the balance between energy security, economic policy, and climate responsibility.


Sources:

  • Reuters, U.S. finalizes tariffs on Southeast Asian solar imports
  • The Guardian, U.S. to impose tariffs of up to 3,521%
  • CNN Business, U.S. wants to slap tariffs as high as 3,500% on solar panels from Southeast Asia

Tuesday, April 15, 2025

Can the U.S. Government Control Treasury Yields During Trade Shocks?

In early April 2025, the U.S. Treasury market was shaken by the announcement of new tariffs by President Donald Trump, including a sweeping 10% baseline tariff and a sharp 145% tariff on Chinese goods. Within days, 10-year Treasury yields surged from under 4% to over 4.5%, sparking concerns over inflation, foreign bondholder behavior, and policy missteps.

As yields climbed, one question dominated Wall Street and Washington: Can the U.S. government prevent or manage such volatility in Treasury yields—especially during politically driven trade shocks?


The Toolkit: Six Ways to Calm the Bond Market

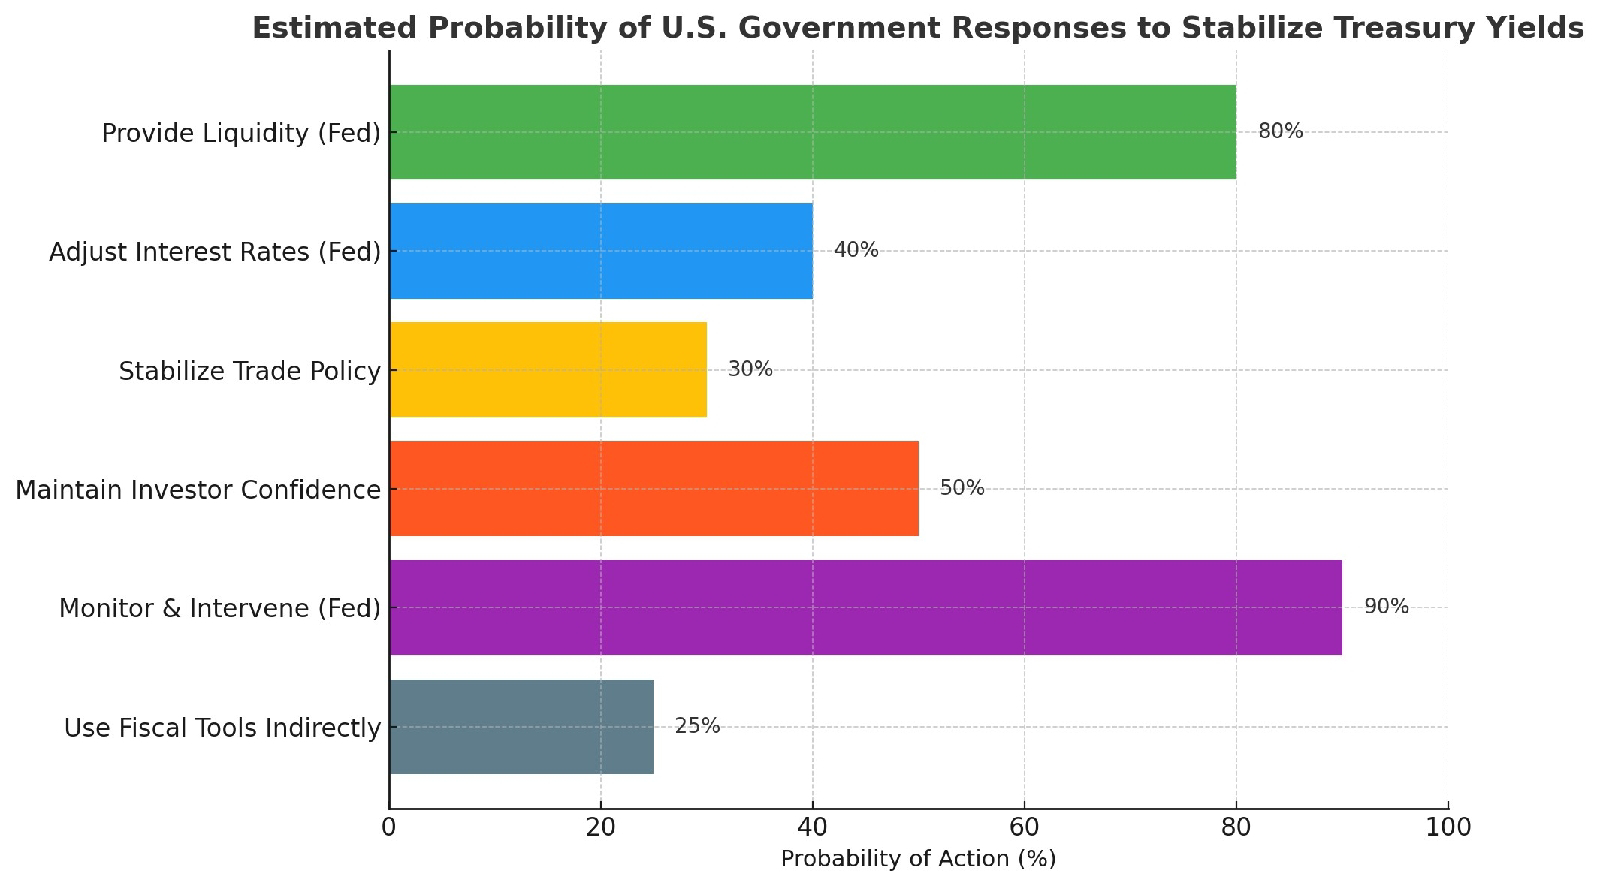
To answer that question, we assessed six potential actions the U.S. government (especially the Federal Reserve) can take to stabilize yields during moments of economic stress. Below is a summary of these policy responses, followed by our estimated probability that each will be deployed.

1. Provide Liquidity (Fed)

Probability: 80%
The Fed can inject liquidity into the market by buying Treasury securities (quantitative easing) or using repurchase agreements. This boosts demand for bonds and lowers yields. It’s a classic and effective tool—and the Fed has used it in virtually every crisis since 2008.

2. Adjust Interest Rates (Fed)

Probability: 40%
Lowering rates can make Treasuries more attractive and drive down yields. However, if inflation is also rising—as it often does during tariff periods—this option becomes politically and economically risky.

3. Stabilize Trade Policy

Probability: 30%
Clear, predictable trade policy reduces uncertainty and restores market calm. For example, the 90-day tariff pause on April 9 temporarily lowered yields. But given the political nature of tariffs, this option is less likely under a protectionist agenda.

4. Maintain Investor Confidence

Probability: 50%
Major holders like China and Japan own trillions in U.S. debt. Their decisions to hold or sell can impact yields. Diplomatic and economic reassurances are key to preventing large-scale bond selloffs.

5. Monitor & Intervene (Fed)

Probability: 90%
The Fed watches bond markets closely and often acts when funding stress emerges. Tools like swap lines, reverse repos, and short-term interventions help maintain market stability. This is the most dependable response.

6. Use Fiscal Tools Indirectly

Probability: 25%
Fiscal tools like bailouts or subsidies can help industries hurt by tariffs, maintaining economic stability and investor confidence. However, they are politically sensitive and usually reserved for deep crises.


Conclusion: Expect the Fed to Act First

While the White House may drive trade tensions, it’s the Federal Reserve that will most likely act to stabilize the bond market. Providing liquidity and monitoring funding stress are well within the Fed’s toolkit—and historically effective.

Still, monetary tools have limits. Without clear trade policy and stable global investor confidence, even the Fed can only do so much. The April 2025 spike in yields was a reminder that markets react not only to interest rates—but to uncertainty.

As inflation pressures, global debt dynamics, and political trade battles evolve, so too must the government’s playbook. For now, the Fed remains the bond market’s first line of defense.


Sources: Federal Reserve releases, CNBC, Reuters, Bloomberg, Atlantic Council, New York Times.


Monday, April 14, 2025

Critical Supply Chain Disruptions: China's Rare Earth Export Restrictions and Their Global Impact

On April 4, 2025, China imposed export restrictions on seven essential rare earth minerals, triggering significant disruptions to global supply chains. This move has far-reaching consequences for industries ranging from defense to renewable energy, and particularly affects the United States, which heavily relies on China for these critical minerals.


The Importance of Rare Earths

Rare earth elements (REEs) are crucial for manufacturing high-performance products in various sectors. These minerals are used in everything from electronics and electric vehicles (EVs) to military technology and renewable energy systems like wind turbines. The seven minerals restricted by China—samarium, gadolinium, terbium, dysprosium, lutetium, scandium, and yttrium—are indispensable in the production of high-tech gadgets, advanced military systems, and green energy solutions.

China currently controls about 90% of the world’s refined rare earth production, making it the dominant supplier in this critical sector. With the U.S. only having one active rare earth mine in Mountain Pass, California, and no substantial domestic processing capacity, this dependency is proving problematic.

Immediate Impacts on U.S. Industries

The export restrictions have led to immediate shortages in the U.S., significantly affecting the following industries:

  1. Defense
    Rare earths are vital for producing missiles, radar systems, and other advanced military technology. These disruptions raise national security concerns, as defense readiness is directly tied to the availability of these materials. The U.S. faces delays in production and a looming risk to military capabilities.

  2. Technology
    From smartphones to laptops and consumer electronics, rare earths are integral to the manufacturing of electronic components such as magnets, screens, and batteries. With these materials now harder to come by, tech manufacturers are struggling to keep up with demand, leading to production delays and increasing prices for consumers.

  3. Automotive (Electric Vehicles)
    Electric vehicles rely on rare earth magnets for their motors. With the auto industry pushing to transition to EVs, any delays in sourcing these materials will slow down production and drive up costs, potentially hindering the green mobility revolution.

  4. Renewable Energy
    Wind turbines, essential for the global push toward renewable energy, also rely on rare earths. The export restrictions on key minerals like dysprosium and terbium may slow the adoption of clean energy technologies, further complicating efforts to meet climate goals.

  5. Healthcare
    In the medical field, gadolinium is used in MRI machines as a contrast agent. A shortage of this rare earth mineral could lead to disruptions in the availability of critical medical equipment, impacting healthcare delivery in hospitals worldwide.

Economic and Cost Implications

With China halting exports, the cost of rare earths is expected to rise sharply. This increase in material costs will likely be passed on to consumers, leading to higher prices for everything from electronics to green technologies and even healthcare products. Industries dependent on these materials may face slower production timelines, increasing their operational costs and potentially reducing their profit margins.

U.S. Strategic Response

The U.S. is already exploring ways to mitigate the impact of China’s restrictions. Efforts are focused on:

  1. Expanding Domestic Mining
    The U.S. government has allocated funding to increase domestic rare earth mining and processing capabilities. Companies like MP Materials in California are being supported to ramp up their operations, but scaling up mining and processing is a long-term process.

  2. Partnering with Allies
    To reduce reliance on China, the U.S. is seeking to establish new trade agreements with countries that possess rare earth deposits, including Australia, Canada, and Brazil. While these countries have access to rare earths, they lack the processing infrastructure that China has perfected over the years, meaning this will take time to set up.

  3. Recycling Rare Earths
    Recycling programs are also being explored as a solution. The U.S. is looking to recover rare earths from end-of-life electronics, such as smartphones and computers, to create a secondary supply chain. While this is a promising avenue, recycling technology is still developing and faces scalability challenges.

Long-Term Outlook

While the immediate effects of China’s rare earth export restrictions are already being felt, the long-term consequences will continue to unfold. The U.S. will likely face ongoing challenges in securing a stable, cost-effective supply of these critical materials. Diversification of supply chains will take time, and full independence from China’s rare earth dominance will require significant investment in domestic mining, processing, and recycling infrastructure.

The situation is also likely to drive a global reconfiguration of supply chains, as countries look to secure their own rare earth sources. Geopolitical tensions are likely to escalate, with nations competing for access to these vital minerals. This could lead to the formation of new trade alliances and shifts in global economic dynamics.

Conclusion

China’s decision to restrict rare earth exports marks a pivotal moment in global trade. The U.S. and other nations will need to act swiftly to diversify their supply chains and reduce their dependence on China for these essential materials. The ongoing shortage of rare earths is not just an economic challenge; it also raises national security concerns that must be addressed at the highest levels of government.

As the world continues to grapple with these disruptions, one thing is clear: Resilient supply chains are critical to ensuring both economic stability and national security. The actions taken today will shape the future of global trade, technology, and energy.


This blog post is designed to give a comprehensive overview of the rare earth export restrictions and their impacts, while offering a balanced perspective on both the immediate challenges and the longer-term responses that are necessary for global supply chain stability.