Translate

Saturday, February 1, 2025

The Shifting Tides: U.S. Trade Deficits with China, Mexico, and Canada (2000-2023)


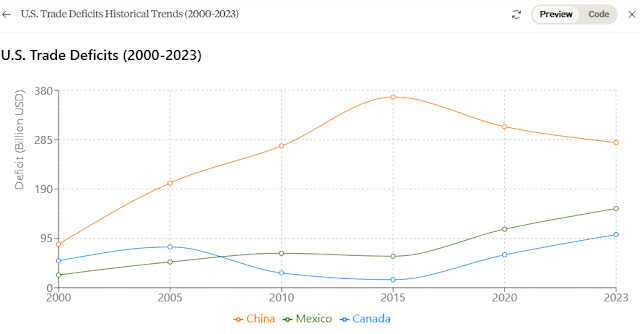
Recent trade data reveals fascinating shifts in America's trading relationships with its three largest partners. As we analyze the trends from 2000 to 2023, we uncover a story of changing global dynamics, regional integration, and economic transformation.

China: The Dragon's Changing Appetite

The China story dominates the narrative of U.S. trade deficits over the past two decades. Starting at $83.7 billion in 2000, the deficit with China skyrocketed to a staggering $367.2 billion by 2015 – a more than fourfold increase. This surge coincided with China's rapid industrialization, its 2001 entry into the World Trade Organization, and its emergence as the world's manufacturing hub.

However, the post-2015 era tells a different story. The deficit has moderated significantly, falling to $279.4 billion by 2023. This decline reflects several factors: increased U.S. export capacity, shifting supply chains, and evolving trade policies. The transformation suggests a maturing trade relationship and possibly signals China's economic transition from export-led growth to domestic consumption.

Mexico: The Steady Climber

While China's deficit commands headlines, Mexico's story is equally compelling. From a modest $24.5 billion in 2000, Mexico's trade deficit with the U.S. has grown consistently, reaching $152.4 billion in 2023 – a sixfold increase. This growth has been remarkably steady, accelerating notably after 2015.

The rise reflects deeper integration of North American supply chains, particularly in automotive and electronics manufacturing. The implementation of NAFTA (now USMCA) has facilitated this integration, creating a more interconnected regional economy. Mexico's proximity to the U.S., competitive labor costs, and improving infrastructure have made it an increasingly attractive manufacturing partner.

Canada: The Volatile Partner

Canada's trade deficit pattern stands out for its volatility. Starting at $51.9 billion in 2000, it peaked at $78.5 billion in 2005, then dramatically fell to $15.5 billion by 2015 – showing the most variable pattern among the three partners. However, recent years have seen a sharp reversal, with the deficit climbing to $102.3 billion by 2023.

This volatility likely reflects several factors:

  • Fluctuations in commodity prices, particularly oil
  • Exchange rate movements between the U.S. and Canadian dollars
  • Changes in cross-border supply chain integration
  • Shifts in natural resource demand and energy markets

The Bigger Picture: Shifting Global Trade Patterns

These trends reveal several important developments in global trade:

  1. Regional Integration: The growing deficits with Mexico and Canada suggest strengthening North American economic integration, possibly accelerated by global supply chain disruptions and nearshoring trends.
  2. China's Transformation: The moderating deficit with China might indicate a rebalancing of the U.S.-China trade relationship and China's economic maturation.
  3. Supply Chain Evolution: The data reflects ongoing shifts in global supply chains, with companies increasingly diversifying their manufacturing bases beyond China.
  4. Policy Impact: Trade policies, from NAFTA/USMCA to various tariff measures, have clearly influenced these patterns.

Looking Ahead

As we move forward, several factors will likely influence these trade relationships:

  • The continued evolution of global supply chains
  • Technological change and automation in manufacturing
  • Climate change policies and their impact on trade
  • Geopolitical tensions and their effect on trade patterns
  • Regional integration initiatives

The U.S. trade deficit story is far from static. While China remains the largest source of trade deficit, the growing importance of regional trade with Mexico and Canada suggests a possible shift toward greater North American economic integration. Understanding these patterns is crucial for policymakers, businesses, and anyone interested in the future of global trade.

These trends remind us that trade relationships are dynamic, influenced by a complex web of economic, political, and technological factors. As we look to the future, the patterns suggest a continuing evolution in global trade dynamics, with regional trade relationships potentially playing an increasingly important role.
Global Economic Performance: A Deep Dive into GDP Indicators

Global Economic Performance: A Deep Dive into GDP Indicators

In today's interconnected world economy, understanding how different nations perform across key economic indicators provides crucial insights into global economic health and trends. This analysis examines the performance of major economies through three critical lenses: GDP growth, inflation rates, and unemployment figures.\

GDP Indicators Rankings

Scoring weights:

  • GDP Growth: 40% (higher is better)
  • Inflation Stability: 35% (lower is better)
  • Employment: 25% (lower jobless rate is better)
Rank
Country
Total Score
Growth Score
Inflation Score
Employment Score
1United States6.547.266.595.31
2Indonesia6.363.159.676.86
3India6.0110.01.465.99
4South Korea5.821.239.278.32
5Australia5.621.518.667.95
6Japan5.591.517.29.88
7Euro Area5.55.073.98.44
8China5.465.345.375.79
9United Kingdom5.291.18.547.47
10Italy5.271.110.05.31
11Canada5.071.519.394.71
12Mexico4.840.276.459.88
13France4.810.969.883.86
14Germany4.730.828.785.31
15Brazil4.252.335.75.31
16Spain3.652.197.930.0
17Russia2.50.00.010.0

Top Performers: A Balanced Approach Wins

India and the United States emerge as standout performers, each demonstrating strength in different areas. India leads with an impressive 6.5% GDP growth rate, showcasing the dynamism of emerging markets. However, this comes with the challenge of managing higher inflation at 8.3%. The United States, meanwhile, maintains robust growth at 4.5% while better controlling inflation at 4.1%, though facing moderate unemployment at 6.2%.

The Asian Economic Landscape

The contrast between Asian economies is striking:

  • China maintains steady growth at 3.1% with moderate unemployment of 5.8%, but faces inflation pressures at 5.1%
  • Japan shows modest growth of 0.3% but maintains remarkably low inflation (3.6%) and unemployment (2.4%)
  • South Korea demonstrates stability with controlled inflation (1.9%) and unemployment (3.7%), though growth remains modest at 0.1%

European Challenges

Europe presents a more challenging picture:

  • Germany, traditionally Europe's economic powerhouse, faces headwinds with -0.2% growth
  • France shows similar struggles at -0.1% growth
  • Spain maintains positive growth at 0.8% but grapples with the highest unemployment rate among major economies at 10.61%
  • The UK holds steady with controlled inflation at 2.5% but flat growth

Emerging Markets: A Mixed Bag

Emerging markets show varying degrees of success in managing their economies:

  • Brazil maintains positive growth at 0.9% with moderate inflation at 4.83%
  • Russia faces challenges with -0.8% growth and high inflation at 9.5%
  • Mexico shows negative growth at -0.6% but maintains relatively low unemployment at 2.4%
  • Indonesia demonstrates resilient growth at 1.5% with well-controlled inflation at 1.57%

Key Takeaways

  1. Growth-Inflation Trade-off: There's a visible trade-off between high growth rates and inflation control, particularly evident in emerging markets.
  2. Employment Stability: Countries with moderate growth but strong institutional frameworks tend to maintain better employment figures, as seen in Japan and South Korea.
  3. Regional Patterns:
    • Asia shows generally stronger growth dynamics
    • Europe faces growth challenges but maintains inflation control
    • Emerging markets demonstrate higher volatility across indicators

Future Implications

The current economic landscape suggests several trends to watch:

  1. Emerging Market Resilience: Despite challenges, emerging markets continue to show stronger growth potential than developed economies.
  2. Structural Challenges: Advanced economies need to find new growth drivers while maintaining their advantages in inflation and unemployment management.
  3. Policy Balance: The data highlights the ongoing challenge for policymakers in balancing growth objectives with inflation control and employment stability.

Conclusion

The analysis reveals that economic success in today's global economy requires a delicate balance across multiple indicators. While some countries excel in particular areas, the most successful economies are those that maintain reasonable performance across all three key indicators: growth, price stability, and employment.

The diversity in economic performance across regions and development levels underscores the complexity of economic management in a globalized world. As we move forward, the ability to maintain this balance while adapting to changing global conditions will likely determine which economies thrive in the coming years.