Translate

Friday, May 3, 2024

Dissecting Broadcom's Financials: A Story of Growth, Profitability, and Shareholder Returns

Broadcom Inc. (AVGO), a leading semiconductor company, has been making waves in the technology industry with its impressive financial performance. In this blog post, we'll delve into the company's financial statements, unveiling a narrative of sustained growth, robust profitability, and a commitment to rewarding shareholders.


Revenue and Profitability: A Stellar Trajectory

Broadcom's revenue growth has been nothing short of remarkable. Over the past four fiscal years, from 2020 to 2023, the company's topline has risen steadily, climbing from $23.9 billion to an impressive $35.8 billion – a compound annual growth rate (CAGR) of approximately 14.4%. This consistent revenue expansion is a testament to the company's strong product portfolio and its ability to capitalize on emerging market opportunities.


But it's not just about top-line growth; Broadcom has also demonstrated an exceptional ability to translate revenue into profits. The company's net income skyrocketed from $3.0 billion in 2020 to a staggering $14.1 billion in 2023. This impressive surge in profitability can be attributed to a combination of revenue growth and operational efficiencies, as evidenced by Broadcom's expanding operating margins, which soared from 17.6% in 2020 to an impressive 46.7% in 2023.


Cash Flow and Capital Allocation: A Shareholder-Friendly Approach

Broadcom's financial strength is further reinforced by its robust cash flow generation. The company's free cash flow has consistently increased, rising from $11.6 billion in 2020 to $17.6 billion in 2023. This strong cash generation capability not only provides Broadcom with financial flexibility but also enables the company to pursue shareholder-friendly initiatives.


One such initiative is Broadcom's active share repurchase program. In the fiscal year 2023 alone, the company allocated a substantial $7.7 billion toward buying back its own shares, demonstrating its confidence in the company's future prospects and its commitment to enhancing shareholder value.


Moreover, Broadcom has consistently returned cash to shareholders through dividend payments. Over the past four years, the company's cash dividends paid have increased from $5.5 billion in 2020 to $7.6 billion in 2023, reflecting its commitment to rewarding patient investors.


Balance Sheet Strength and Disciplined Capital Allocation

Broadcom's financial prowess is further reinforced by its robust balance sheet. Despite a slight decrease in total assets from $75.9 billion in 2020 to $72.9 billion in 2023, primarily due to a reduction in goodwill and intangible assets, the company has maintained a relatively conservative capital structure. Broadcom's total debt has remained relatively stable, ranging from $39.2 billion to $41.1 billion over the four-year period.


Furthermore, the company has demonstrated disciplined capital allocation, with capital expenditures remaining relatively low, ranging from $424 million to $463 million annually. This capital-light business model allows Broadcom to allocate resources more efficiently, further bolstering its financial strength and shareholder returns.


Conclusion

Broadcom's financial statements tell a compelling story of sustained growth, profitability, and a commitment to rewarding shareholders. With its strong revenue trajectory, expanding margins, robust cash flow generation, and shareholder-friendly capital allocation strategies, Broadcom has positioned itself as a formidable player in the semiconductor industry. As the company continues to navigate the ever-evolving technology landscape, its financial prowess and disciplined approach to capital allocation should continue to drive long-term value creation for its investors.

Thursday, May 2, 2024

A Deep Dive into Oracle's Financials: Balancing Growth and Debt


Oracle, a tech giant known for its cloud services and software solutions, has shown steady growth in recent years. However, a closer look at its financial statements and key metrics reveals a more complex picture. In this blog post, we'll analyze Oracle's financial health and discuss its strategies for growth and managing debt.


Steady Revenue Growth and Strong Margins

Oracle has demonstrated consistent revenue growth, with a 28% increase from $39.1B in 2020 to nearly $50B in 2023. The company's 7.1% growth rate ranks at the 64th percentile among its peers. Moreover, Oracle maintains healthy operating margins between 27-37% and boasts a strong 71.5% gross margin, placing it at the 82nd percentile in terms of profitability.


Aggressive Spending on Share Repurchases and Acquisitions

Oracle's cash and investments have significantly decreased from $46.6B in 2021 to $10.2B in 2023. This decline can be attributed to the company's aggressive spending on share repurchases and acquisitions. In 2021 alone, Oracle spent $21B on share buybacks, which reduced to $2.5B in 2023. Additionally, the company's goodwill increased from $43.8B to $62.3B between 2022 and 2023, likely due to acquisitions.


Rising Debt Levels and Declining Stockholders' Equity

To fund its share repurchases and acquisitions, Oracle has relied on debt financing. Long-term debt has risen from $69.2B in 2020 to $86.4B in 2023, resulting in a high debt-to-equity ratio of 1,423.2 (98th percentile) and a net debt of $80.7B. Consequently, stockholders' equity has declined from $12.1B in 2020 to $1.1B in 2023.


Strong Cash Flows and Market Valuation

Despite the increased debt levels, Oracle generates strong operating cash flows, ranging from $9.5B to $17.2B annually over the last four years. The company also maintains a sizeable free cash flow of $12.1B (73rd percentile). Oracle's market capitalization stands at $318.3B (78th percentile), with a P/E ratio of 30.6 (68th percentile) and a high P/B ratio of 56.6 (96th percentile), indicating a strong market valuation.


Balancing Growth and Debt Management

Oracle's financial performance showcases a company focused on growth through acquisitions and share repurchases. While the company's revenue growth, margins, and cash flows remain strong, the increasing debt levels and declining stockholders' equity raise concerns about its long-term financial health.


Moving forward, Oracle must strike a balance between maintaining growth and managing its debt. The company's ability to generate strong cash flows and maintain profitability will be crucial in servicing its debt obligations. Additionally, investors should keep an eye on Oracle's P/B ratio, as the high value suggests that the market may be overvaluing the company's stock relative to its assets.


In conclusion, while Oracle's financial performance demonstrates its strength in the tech industry, the company must navigate the challenges posed by its aggressive growth strategies and rising debt levels. By focusing on sustainable growth, effective debt management, and maintaining strong cash flows, Oracle can continue to thrive in the ever-evolving technology landscape.

Analyzing Microsoft's Financial Health in 2024: A Comprehensive Overview


Introduction: In today's fast-paced technology landscape, Microsoft stands tall as a giant, consistently delivering impressive financial results. As investors and industry observers, it's crucial to understand the company's financial health and future prospects. In this blog post, we'll take a deep dive into Microsoft's financial statements and key metrics, providing insights into the company's growth, profitability, and overall financial position. Robust Revenue Growth: One of the most striking aspects of Microsoft's financial performance is its consistent revenue growth. From 2020 to 2023, the company's total revenue surged from $143 billion to $212 billion, showcasing its ability to expand its business across various segments. This strong revenue growth places Microsoft in the 94th percentile among other companies, highlighting its exceptional performance in the market. Profitability and Operating Leverage: Microsoft's profitability is equally impressive. The company's gross profit margins have remained stable around 69%, indicating its ability to maintain high profitability on its products and services. Moreover, Microsoft's operating income rose from $53 billion to $89 billion over the period, with operating margin expanding from 37% to 42%. This demonstrates the company's excellent operating leverage, as it effectively translates revenue growth into increased profits. Microsoft's high return on equity (ROE) of 38.49% further confirms its strong profitability, ranking in the 81.61st percentile among other stocks. Cash Flow Generation: One of Microsoft's greatest strengths is its ability to generate substantial cash flow. In 2023, the company's operating cash flow reached an impressive $88 billion. Despite increased investments in growth through capital expenditures, Microsoft's free cash flow remains robust at nearly $60 billion, placing it in the 97.53rd percentile among other companies. This strong cash generation allows Microsoft to return significant value to shareholders through buybacks and dividends, although its dividend yield of 0.74% is relatively low compared to other stocks. Healthy Balance Sheet: Microsoft's financial position is further bolstered by its healthy balance sheet. With $111 billion in cash and investments, the company has ample liquidity to navigate any challenges and seize growth opportunities. Microsoft's debt-to-equity ratio of 41.96 is in the 20th percentile, indicating a relatively low debt level compared to other companies. The company's current assets of $184 billion comfortably exceed its current liabilities of $104 billion, providing a solid financial foundation. Market Valuation and Investor Confidence: The market's confidence in Microsoft is evident in its high valuation. With a market capitalization exceeding $3 trillion, Microsoft ranks in the 99th percentile among other companies. Investors are willing to pay a premium for Microsoft's shares, as reflected in its high price-to-earnings (P/E) ratio of 35.21 (77.89th percentile) and price-to-book (P/B) ratio of 11.94 (80.65th percentile). This market sentiment underscores the belief in Microsoft's strong financial performance and future growth prospects. Conclusion: Microsoft's financial statements and key metrics paint a picture of a company with unparalleled financial strength. Its robust revenue growth, high profitability, strong cash generation, and healthy balance sheet consistently place it above the 75th percentile in most financial measures compared to other stocks. As Microsoft continues to invest in innovative technologies and maintains its leadership position, it is well-positioned to deliver long-term value to its shareholders. With its solid financial foundation and market confidence, Microsoft is poised for continued success in the dynamic technology industry.

Construction Spending Data Shows Diverging Residential and Nonresidential Trends

The U.S. Census Bureau released its latest construction spending report yesterday, and the data highlighted some shifting patterns across residential and nonresidential sectors.


SectorLatest Monthly % ChangeLatest Annual % Change
Total Construction-0.29.6
Residential-0.74.5
Private Construction-0.57.3
Nonresidential0.213.7
Private Residential-0.74.4
Private Nonresidential-0.211.1
Public Construction0.817.9
Public Residential0.515.5
Public Nonresidential0.817.9
Note: All percentages are rounded to one decimal point.
Overall, total construction spending has increased by 9.6% annually, despite a slight decrease of 0.2% from the previous month. Residential construction spending has slowed down, with a monthly decrease of 0.7% and an annual increase of 4.5%. Nonresidential construction, on the other hand, has seen a significant annual growth of 13.7%, with a slight monthly increase of 0.2%. Public construction spending has experienced a substantial annual growth of 17.9%, with a monthly increase of 0.8%.

At the headline level, total construction spending dipped by 0.2% in March compared to February, according to the seasonally adjusted estimates. However, the year-over-year growth remained extremely robust at 29.6%.


Residential Construction Cools, Nonresidential Stays Hot

Breaking it down further, we saw residential construction spending contract by 0.7% month-over-month in March. This continued a cooling trend as elevated mortgage rates and high home prices have weighed on buyer demand over the past year. 


Year-over-year, residential construction spending was still up a healthy 14.5% annually. But the slowing monthly pace aligns with other housing data pointing to a moderation in that sector.


In contrast, nonresidential construction spending rose by 0.2% in March and clocked a sturdy 13.7% annual growth rate. The nonresidential segment has benefited from solid business investment in projects like commercial real estate, manufacturing facilities and infrastructure.  


Private vs Public Split

When separating out private vs public spending, private nonresidential outlays edged down 0.2% for the month, but were still up 11.1% compared to March 2023 levels.  


Meanwhile, public nonresidential construction had a very strong month, rising 0.8% in March and surging by 17.9% year-over-year. This reflects increased state and federal funding flows into infrastructure programs.


Economic Crosscurrents 

Overall, the construction spending data depicts crosscurrents in the economy. As interest rates have risen to combat inflation, the housing market has slowed from its torrid pandemic pace. But business investment and public sector construction have remained quite elevated.


Looking ahead, the trajectory of construction spending will depend on the broader economic environment, policymaker actions, business capital expenditure plans, and labor/materials availability. But the sector overall continues motoring along at historically high levels nationally.


For industry participants and economic analysts, keeping a close eye on these construction trends will be crucial in the months ahead. The latest release affirms this is one of the bright spots helping prop up the U.S. economy so far in 2024.

Wednesday, May 1, 2024

Labor Market Shows Signs of Cooling Based on Latest JOLTS Data


The Job Openings and Labor Turnover Survey (JOLTS) for [insert latest month/year] was released today by the U.S. Bureau of Labor Statistics, providing insights into the state of the labor market. The latest figures indicate a cooling job market across various sectors of the economy.


A key metric in the JOLTS data is the number of job openings, which fell sharply in the latest report. Total nonfarm job openings dropped by 3.7% from the previous month and 11.8% from a year ago. This signals employers are becoming more cautious about expanding their workforce amidst economic headwinds.  


Some sectors saw particularly steep declines in open positions. The construction sector experienced a staggering 39.9% monthly drop in job openings, likely driven by higher interest rates weighing on housing and construction activity. Manufacturing job openings also fell 2.9% from the prior month and 17.7% annually, reflecting softness in the goods-producing side of the economy.


Hiring and Separations Down

In line with fewer job openings, the hiring rate also cooled. Total nonfarm hires declined 4.9% over the month and 7.6% from a year earlier. On the other side, total separations (including quits, layoffs, and discharges) decreased by 6.1% monthly but were down 12.1% compared to a year ago.


The quits rate, which can be a measure of workers' willingness to leave jobs, dropped substantially. Quits in the total private sector plunged 8.0% from the prior month and 14.8% over the year, while total nonfarm quits fell 5.6% and 12.6% over the same periods. This pullback in quitting likely indicates employees are becoming more cautious about changing jobs in the current environment.  


Layoffs Tick Down But Remain Low

One positive sign is that the layoffs and discharges rate continues to decline, though at a slower pace than other metrics. Layoffs fell 9.2% over the month and 16.4% annually for total nonfarm workers. This suggests that while hiring is slowing, employers are still reluctant to make deeper workforce cuts.


Overall, the latest JOLTS report shows the labor market hitting a speed bump. Faltering job openings, cooler hiring, and reduced voluntary separations point to rising caution among workers and employers alike as economic uncertainty persists. However, the limited layoffs indicate that a more severe labor market downturn may not yet be imminent. Upcoming JOLTS and employment reports will shed more light on whether this cooling trend develops into a broader freezing of the job market.

Amgen Delivers Solid Growth Amid High Debt Levels

Amgen Inc. (AMGN) is a leading biotechnology company that has demonstrated strong financial performance over the past few years. In this blog post, we will delve into Amgen's financial statements, key metrics, and valuation to provide a comprehensive analysis of the company's current position and future prospects.


Financial Performance:

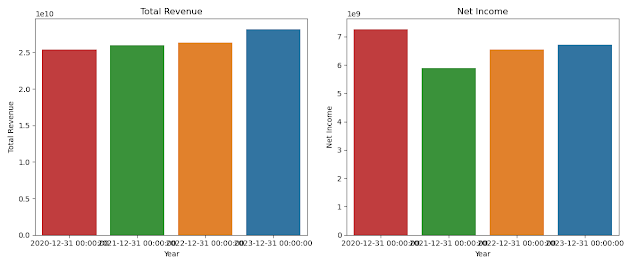
Amgen's revenue has grown steadily from $25.4 billion in 2020 to $28.2 billion in 2023, representing a 10.8% increase over three years. The company's impressive revenue growth of 22% ranks in the 95th percentile among its peers, highlighting its strong market position. Amgen has maintained healthy operating margins ranging from 33% to 36%, and its gross margin of 70.4% ranks in the 80th percentile, indicating robust profitability.


The company's net income has remained stable, fluctuating between $5.9 billion and $7.3 billion over the past four years. Amgen's EPS of 7 ranks in the 62nd percentile, suggesting a solid earnings performance compared to its peers. Free cash flow generation has been consistently strong, exceeding $7 billion annually, although it ranks in the 36th percentile compared to other companies.


Valuation:

Amgen's stock trades at premium valuation multiples compared to its peers. The company's P/E ratio of 44.47 and P/B ratio of 33.23 rank in the 84th and 91st percentiles, respectively. This indicates that investors are willing to pay a higher price for Amgen's stock, reflecting their confidence in the company's growth prospects and financial stability. Additionally, Amgen offers a dividend yield of 2.89%, which is slightly above average and ranks in the 59th percentile.


Balance Sheet and Leverage:

One area of concern for Amgen is its increasing leverage. The company's net debt has risen from $26.7 billion in 2020 to $53.7 billion in 2023, primarily due to significant spending on acquisitions. Amgen's debt-to-equity ratio of 1274.79 is exceptionally high, placing it in the 95th percentile among its peers. This high level of debt may raise eyebrows among investors and warrants close monitoring.


Furthermore, goodwill and intangibles constitute a substantial portion of Amgen's total assets, accounting for $51.3 billion or 53% of the total. This significant amount of intangible assets may expose the company to potential impairment risks in the future.


Profitability and Cash Flow:

Despite the increased leverage, Amgen showcases strong profitability metrics. The company's return on equity (ROE) of 72.58% ranks in the 91st percentile, indicating its efficiency in generating returns for shareholders. However, operating cash flows have declined from $10.5 billion in 2020 to $8.5 billion in 2023, although they remain at healthy levels.


Conclusion:

Amgen Inc. (AMGN) exhibits strong financial performance, with steady revenue growth, stable net income, and robust profitability margins. The company's premium valuation multiples reflect investor confidence in its future prospects. However, investors should keep a close eye on Amgen's increasing leverage and high debt-to-equity ratio, as well as the significant amount of goodwill and intangibles on its balance sheet.


Despite these concerns, Amgen's strong market position, solid earnings performance, and healthy free cash flow generation make it an attractive investment opportunity for those who believe in the company's ability to manage its debt and continue its growth trajectory. As always, investors should conduct their own thorough research and consider their individual investment goals and risk tolerance before making any investment decisions.


Inside MA's Financial Powerhouse

MA (potentially MasterCard) has cemented itself as a financial industry leader, riding on the wave of digital payments and cashless transactions. A deep dive into their recent financial statements reveals a company firing on all cylinders.


Revenue Rocketing Higher

Top-line growth has been the story for MA, with revenue soaring from $15.3 billion in 2020 to $25.1 billion in 2023 - an impressive 64% increase in just three years. This meteoric rise is a testament to MA's dominant market position and their ability to capitalize on global trends like increasing e-commerce adoption. 


Profits Gushing Higher

The revenue gains have translated into surging profits as well. Operating income jumped from $8.1 billion to $14.6 billion over the same 2020-2023 period. With cost discipline keeping expenses in check, MA's operating margins have expanded substantially. Robust net income growth affirms the company is deftly navigating the inflationary environment.


Cash Flow Juggernaut 

MA's cash flow statements reveal the company is truly an Empire State Building of cash generation. Free cash flow has steadily climbed, reaching a staggering $10.9 billion in 2023 - up 67% versus 2020 levels. This copious cash wave is allowing MA to invest for the future while also rewarding shareholders.


Shareholder Rewards

Speaking of shareholders, MA is treating them like royalty. The company has gone on an epic share buyback binge, repurchasing over $17 billion worth of its stock in just 2022 and 2023! Dividends have grown as well, with the latest $2.16 billion payout representing a 34% increase from 2020. For income investors, that translates into a modest but growing dividend yield around 0.55%.


Levered for Growth 

To fuel its growth ambitions, MA hasn't shied away from leveraging its fortress balance sheet. Long-term debt has increased from $12 billion in 2020 to over $14 billion by 2023 as the company took on new borrowings. This added leverage provides MA with ample firepower for continued investments and acquisitions.


Monitoring the Risks

While the overall picture is bright, there are a couple yelloared lights to monitor. First, MA's aggressive share repurchases have steadily depleted its cash reserves from $10.1 billion down to $8.6 billion over the past three years. Second, the company's ballooning debt levels have caused its debt-to-equity ratio to spike above 200% - a high but still manageable level for this cash-gushing business.


Overall, MA's financial performance over the past few years has been simply masterful. With powerful tailwinds, outstanding execution, and shareholder-friendly capital allocation, MA looks poised to remain a dominant force reshaping how the world pays. Investors should keep a close watch on this payments Processing juggernaut.