Translate

Thursday, August 17, 2017

Emerging Stock Markets Leverage 3X ETFs


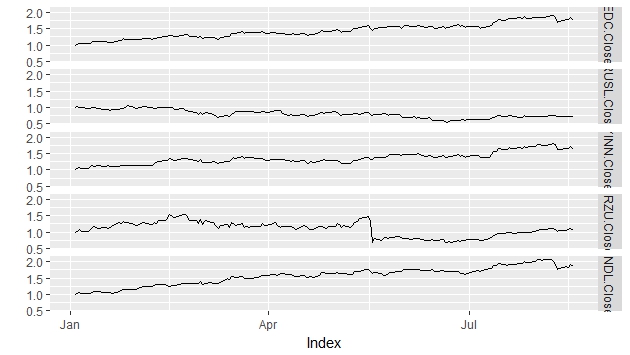
The emerging stock markets:

EDC (Direxion Daily MSCI Em Mkts Bull 3X ETF (EDC))

RUSL (Direxion Daily Russia Bull 3X Shares(RUSL)) 

YINN (Direxion Daily FTSE China Bull 3X ETF (YINN))

BRZU (Direxion Daily MSCI Brazil Bull 3X ETF (BRZU))

INDL (Direxion Daily MSCI India Bull 3X Shares )


If you have invested $1.00 at the beginning of year, then the returns would be following: India would the highest yield among emerging countries.

           EDC.Close RUSL.Close YINN.Close BRZU.Close INDL.Close
2017-08-10  1.703108  0.7183414   1.611931   1.011147   1.752255
2017-08-11  1.720110  0.7172208   1.619628   1.040188   1.789659
2017-08-14  1.772395  0.7162869   1.661963   1.044881   1.859186
2017-08-15  1.775503  0.7209563   1.651058   1.077442   1.839824
2017-08-16  1.831810  0.7293612   1.724182   1.117630   1.914631
2017-08-17  1.758318  0.7259993   1.622835   1.058082   1.853685


Wednesday, August 16, 2017

Five ETFs associated with crude oil


There are five types of ETFs that you can invest associated with crude oil prices: USO, UCO, OIL,  SCO and DNO

When the crude oil prices are expected to rise, you can buy these ETFs:

USO - United States Oil 

UCO - Proshare Ultra Bloomberg Crude Oil 

OILPath Goldman Sachs Crude Oil Total Return (OIL)

When the crude oil prices are expected to decline, you can buy these ETFs:

SCOProShares UltraShort Bloomberg Crude Oil (SCO)

DNO - United States Short Oil (DNO)

  The following chart displays the movement of ETFs since January 2017.

If you have invested $1.00 at the beginning of this year, then the gains as of 8/16/2017 are:         


     USO          UCO            OIL             SCO          DNO

0.8365385 0.6715950  0.7902439    1.251664     1.141328


Wednesday, August 9, 2017

Oil and Copper Prices

library(Quandl)
library(ggplot2)
library(tseries);library(timeseries);library(xts);library(forecast)
library (quantmod)
library(psych)
library(ggfortify)

oil_price=Quandl("OPEC/ORB", start_date="2014-01-01", type='xts')
copper_price=Quandl("LME/PR_CU.1", start_date="2014-01-01", type='xts')

combined=merge(oil_price, copper_price)

autoplot(combined)

Both oil and copper have been rising lately and copper prices rose faster than oil prices.


ratio=copper_price/oil_price
autoplot(ratio)
summary(ratio)

Copper becomes more expensive than oil lately.


Saturday, August 5, 2017

KOSPI Download from Google with R

library(quantmod) #install.package(quantmod)
library(plotly) #install.package(plotly)
library(Quandl)
#setting data


getSymbols("KRX:KOSPI", source='goolge') #KOSPI

KOSPI.data <- data.frame(apply(`KRX:KOSPI`,2,rev))
View(KOSPI.data)

candleChart(KOSPI.data, up.col = "black", dn.col = "red", theme = "white", subset = "2017-01-04/")
addSMA(n = c(20, 50, 200))
addBBands()
addMACD()


Download Bit Coin Prices from Quandl

library(Quandl)
library(ggplot2)
library(tseries);library(timeseries);library(xts);library(forecast)
library (quantmod)
library(psych)


bit_coin=Quandl("BITSTAMP/USD", start_date="2014-01-01", type='xts' )[,c("Date","Last")]
oil_price=Quandl("OPEC/ORB", start_date="2014-01-01", type='xts')


candleChart(bit_coin, up.col = "black", dn.col = "red", theme = "white", subset = "2017-01-04/")
addSMA(n = c(20, 50, 200))
addBBands()
addMACD()


Tuesday, July 4, 2017

Total Construction Spending: Residential (TLRESCONS)

Total Construction Spending on Residential (TLRESCONS) as of May 2017 is shown below. The spending is still below the peak before the financial crisis.


The spending on residential construction has been increasing above 10% since 2011. The spending on construction spending has been increasing at 2.7% as of May 2017. 
 The monthly changes in construction spending on residential decreased in May 2017.
 However, the changes from the same period in a previous year is still above 10%.
 The changes from the previous year will gradually decline in near future.


Source: Bureau of Census


The following R codes generate the charts above:

library(Quandl)
library(ggplot2)
library(forecast)
library(quantmod)

getSymbols('TLRESCONS', src='FRED' ) # FRED

mydata<-(TLRESCONS)


write.table(mydata, "mydata.txt",  sep=" ")

chartSeries(mydata)

names (mydata)[1] <- "Value"


Annual_Return <- annualReturn(mydata)*100
Monthly_Return <- monthlyReturn(mydata)*100
Weekly_Return <- weeklyReturn(mydata)*100


Diff=Delt(mydata, k=12)*100

plot(Diff, main='Changes from previous year')


summary(Monthly_Return)

Annual_Return

plot(Monthly_Return)

chartSeries(Monthly_Return)
addEMA()
addBBands()


barplot(Annual_Return, main='Annual Changes', col='blue')

barplot(last(Monthly_Return, '5 year'), main='Monthly Changes', col='red')


#Historigram

hist(Monthly_Return,
     main="Histogram of Monthly Changes",
     xlab="blue",
     col="green",
     prob=TRUE
   
     )
lines(density(Monthly_Return))


barplot(Monthly, main='Monthly Changes',xlab='Year',
        ylab= 'Percent Changes', col='red')


fit <- arima(Diff, order=c(1, 0, 0))

fit


# predictive accuracy
library(forecast)
accuracy(fit)

# predict next 5 observations
library(forecast)
forecast(fit, 12)
plot(forecast(fit,12))